Videos
Animated number counter video
A counting number is a scene role, not an effect you bolt onto text. You type the figure the way it should read, and the renderer works out what is a number and what is decoration, then counts the number up and leaves the decoration alone.
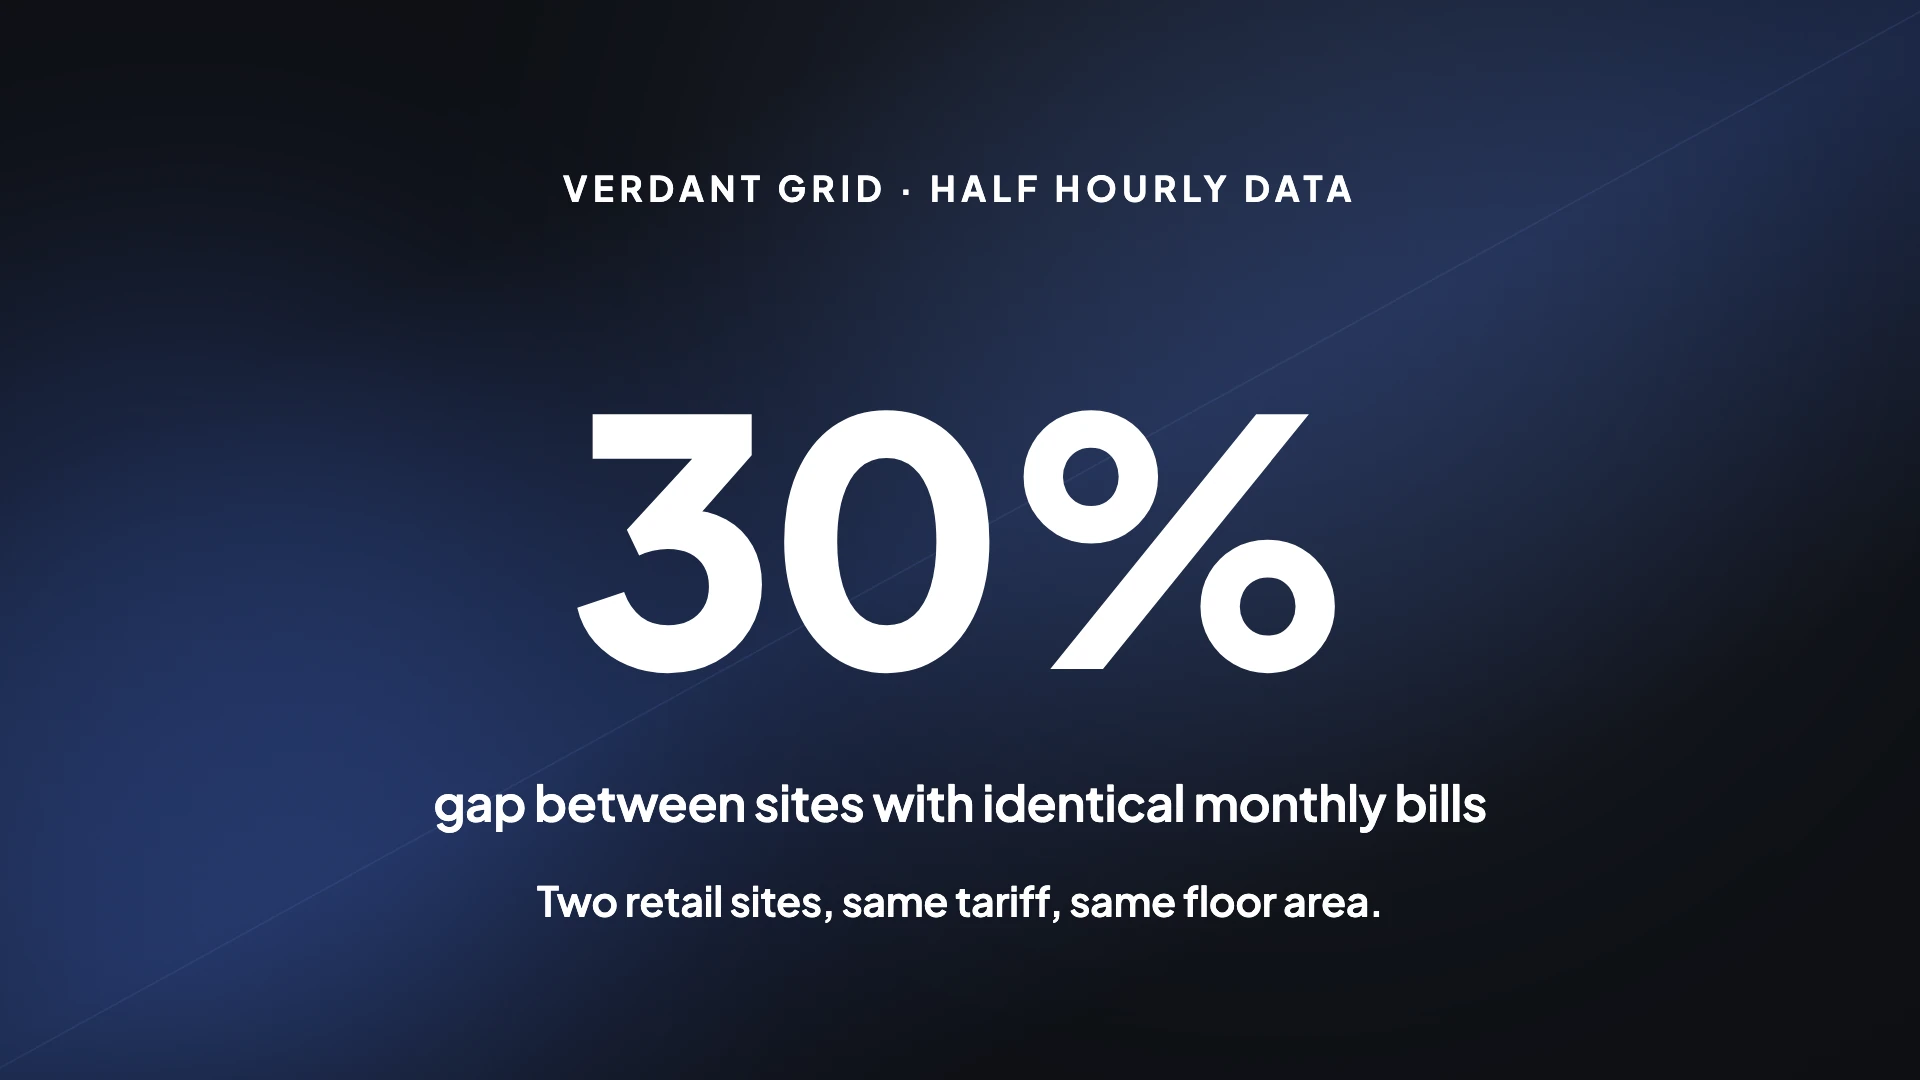
One number, given the whole frame
Twelve scenes carry the stat role. They differ in staging rather than in what they hold: a monumental centred numeral, a percentage ring, an odometer with context chips, a numeral standing on a full width rule, a bounce drop figure, a number over a full bleed trend chart, a stat wrapped inside a sentence, a soft glowing circle, and one that states a plain fact with a source line and no number at all. The role exists to prove a single claim, which is why the number gets the frame to itself.
Four fields, and the numeral is tiny
A stat scene carries an eyebrow of about twenty four characters, the numeral itself, a label and a line of context. The numeral field is budgeted at around five characters, which is not a mistake: 10k+, 82%, 3.4x, 51. Set at over five hundred pixels of type it fills the frame, and a nine character number in that space is unreadable at any size. If your figure needs more room than that, it is a chart.
How the count up reads what you type
The renderer splits the text into a leading part, the number, and a trailing part. So $1,250 counts the 1250 and keeps the dollar sign; 82% counts the 82 and keeps the percent; 3.4x counts to 3.4 with one decimal and keeps the x. Commas are stripped for the arithmetic and put back for display once the figure passes a thousand, and the decimals you typed are the decimals it shows. Type the number the way it should end up reading and the animation follows.
The number has to be yours
The director is told never to invent a figure, so a brief with no numbers in it does not come back with a confident stat scene full of made up ones. That is the right behaviour for the one scene whose entire job is to be believed. Put the figure, its unit and what it measures into the brief, and put the source in the context line if the claim is one somebody might check.
Stat, stat grid, or chart
One number that carries the argument is a stat. Several numbers that only mean anything together are a stat grid, which has its own six layouts and counts each one up with its own label. A trend, a breakdown or anything with a shape is a chart. The mistake to avoid is a stat scene for a number nobody asked about, which spends four seconds proving something that was never in doubt.
How it works, in three steps
Step 1
Put the figure in the brief
With its unit and what it measures. The director will not invent one, so a vague brief gets no stat scene.
Step 2
Keep the numeral to about five characters
82%, 10k+, 3.4x, 51. The type is set huge, so a long number cannot be read anyway.
Step 3
Write the label and the context line
The label names the measure, the context line says over what period or against what baseline.
Step 4
Check the count reads right
Type it as it should appear. Prefixes and suffixes survive the count; only the digits move.
The full walkthrough with screenshots is in the guide Make a promo video with AI voiceover.
Limits worth knowing
- Twelve scenes carry the stat role; several numbers at once is the stat grid role instead.
- The numeral field is budgeted at about five characters.
- The count up parses one number per field: a leading prefix, the digits, then a trailing suffix.
- Decimals shown match the decimals you typed; commas are re-added above a thousand.
- The director is instructed never to invent a figure, so an empty brief produces no stat.
Questions people ask
Can I animate a number in any scene?
No, and that is deliberate. The count up is an entrance on a slot, and the stat scenes are the ones authored with it on the numeral. Adding a big number to a statement scene gives you a big number that fades in. If you want the count, use the role built for it.
Does it keep my currency symbol and percent sign?
Yes. The renderer splits what you type into the part before the digits, the digits, and the part after, then counts only the digits. $1,250 keeps its dollar sign and gains its comma back as it passes a thousand; 82% keeps the percent throughout. You never type the animation, only the final reading.
How does it handle decimals?
It shows exactly as many decimal places as you typed. 3.4x counts up through one decimal place and lands on 3.4; 3.40x would count through two and land on 3.40. If the tenths matter, type them; if they do not, leave them off and the count runs in whole numbers.
What if my number is long?
Shorten it or change the scene. The numeral is budgeted at about five characters because it is set over five hundred pixels tall, and 1,284,930 at that size runs off the frame. Round it to 1.3M, or move to a chart if the precision is the point.
Will it make up a number if I do not give one?
No. The instruction not to invent figures is explicit, so a brief with no numbers comes back without a stat scene rather than with an invented one. That is the behaviour you want on the scene whose only job is to be believed.
When should I use a chart instead?
When the shape of the data is the argument: a trend over time, a breakdown, a comparison of several series. A stat proves one figure. A chart shows a relationship. If somebody would reasonably ask compared with what, and the answer needs more than a context line, it is a chart.
Make your own video
The button opens the generator with this use case already described. Change the wording to match yours, generate, then edit anything you like.
Create a video with OneCraftRelated pages
Countdown offer video
Urgency in a video is a scene, not a widget. A countdown scene sets a deadline in type large enough to read in a feed at arm's length, and it will not be built at all unless your brief contains a real date. What it never does is count down against a live clock, which is worth understanding before you plan a campaign around it.
Nonprofit video maker
Charity video has a counterintuitive finding at its centre. A large number describing suffering suppresses the response rather than increasing it, while one identifiable named person increases it. So the cold open is a person, and the statistic waits until after the audience already cares.
Animated chart in a video
A chart scene exists for the case where the shape of the data is the point, rather than one headline figure. Bars racing to different heights, a line climbing, a waterfall building to a total. All of it drawn from numbers you actually supply, because the director is not permitted to make any up.
More finished work of this kind is on the video examples hub.
Written and checked by the OneCraft team. Last checked .