Poster examples
Research posters, block by block
Every poster here is a whole A0 board, read the way a conference reader reads one: the finding first, then the abstract, the method as a labelled protocol, the figures with their captions, and the references. The studies are invented, the structure is how the field actually writes them.
40 examples, page 1 of 2
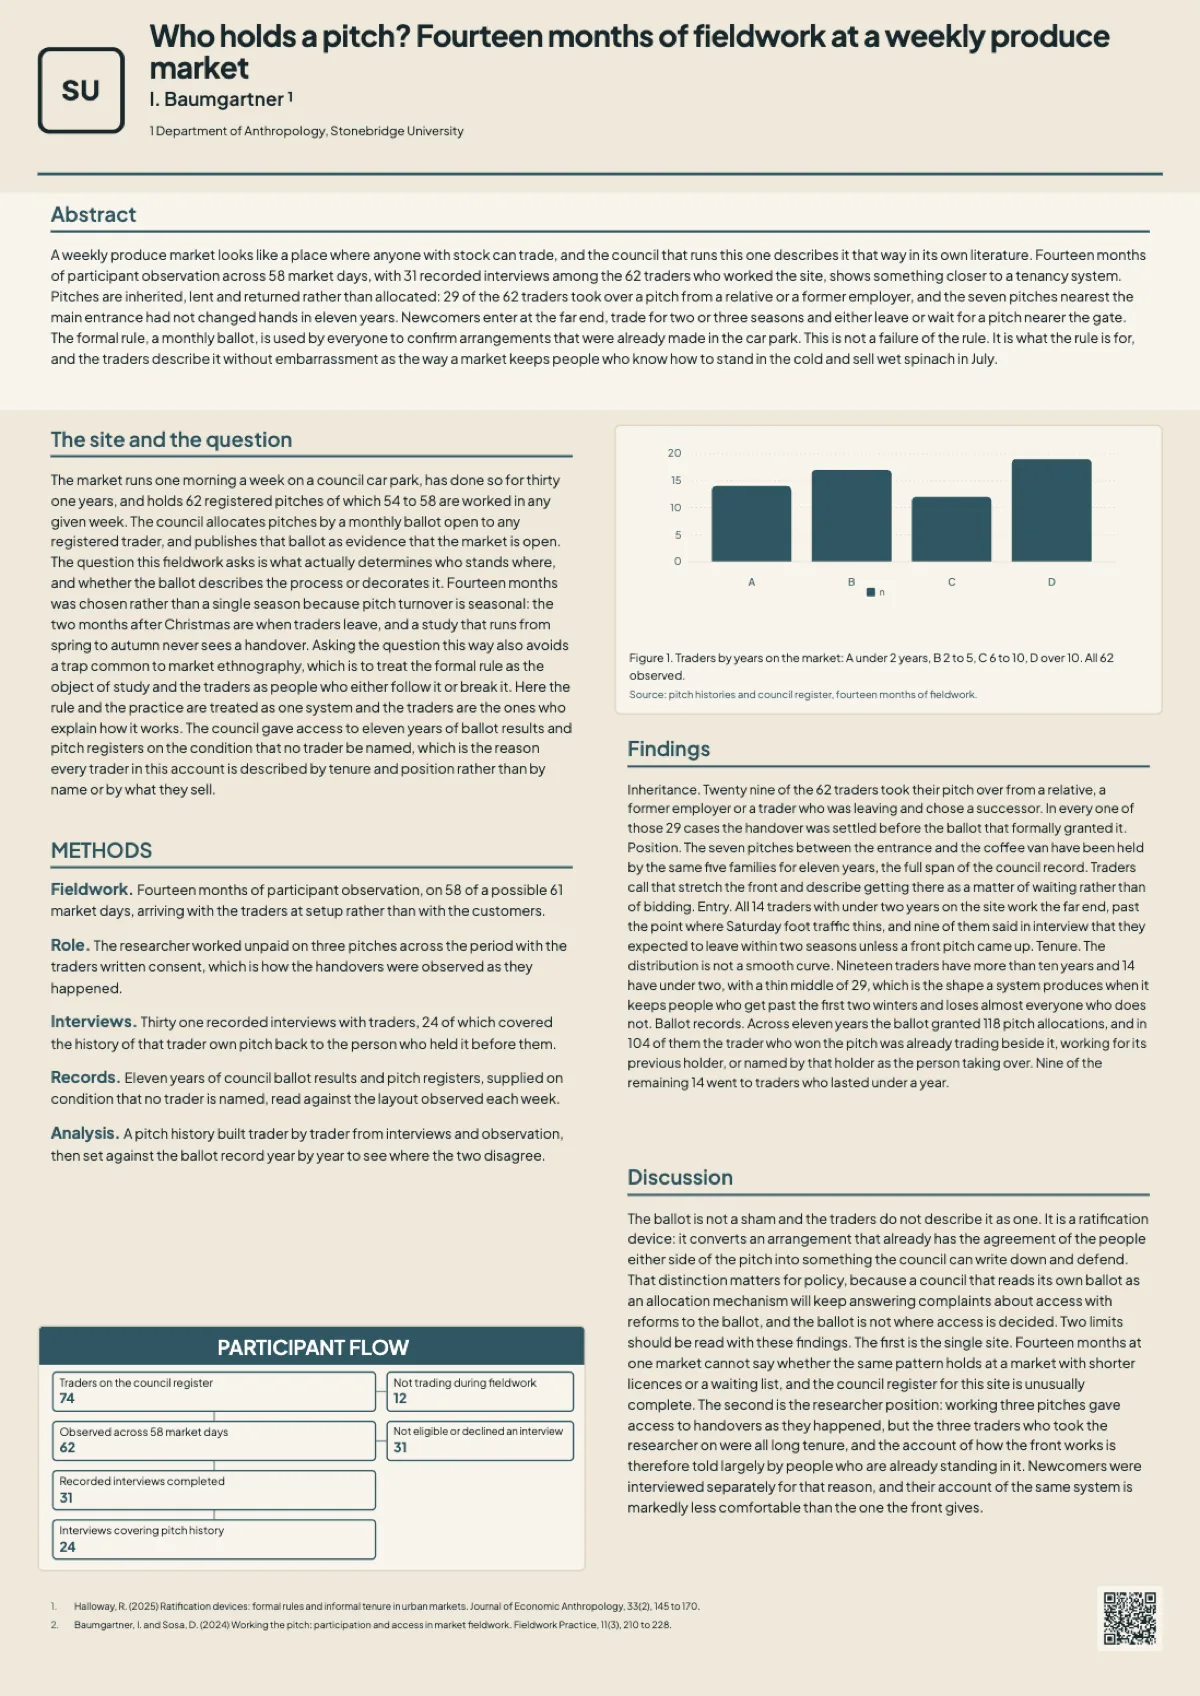
Anthropology research poster example
Fourteen months of participant observation at a weekly produce market, laid out as an A0 portrait board in a journal style two column grid. The board treats ethnography the way a journal does: abstract, site, method, findings and discussion, with the counts a reader can check.
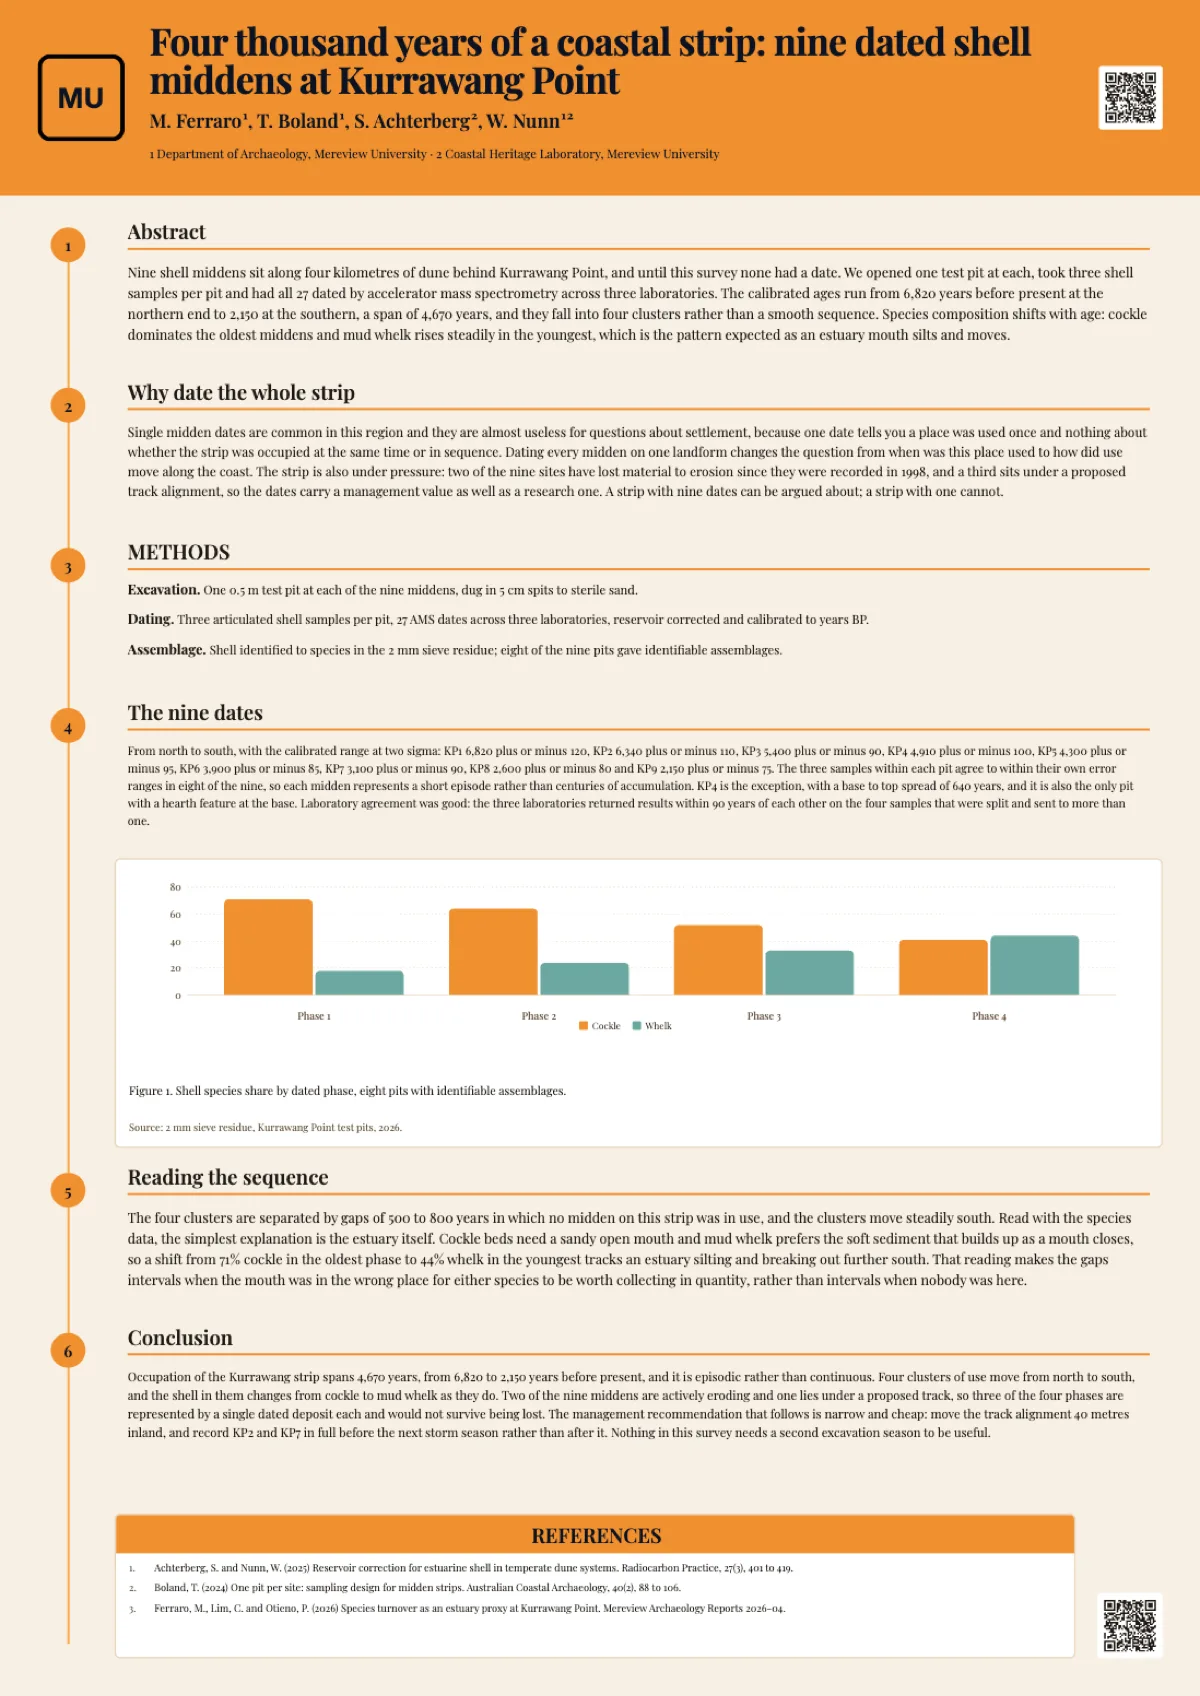
Archaeology research poster example
Nine shell middens dated along four kilometres of coastal dune, laid out on an A0 portrait board with a numbered rail running down the left. The rail turns the board into a reading order, so a visitor who starts at node one finishes at the conclusion without being told where to go.
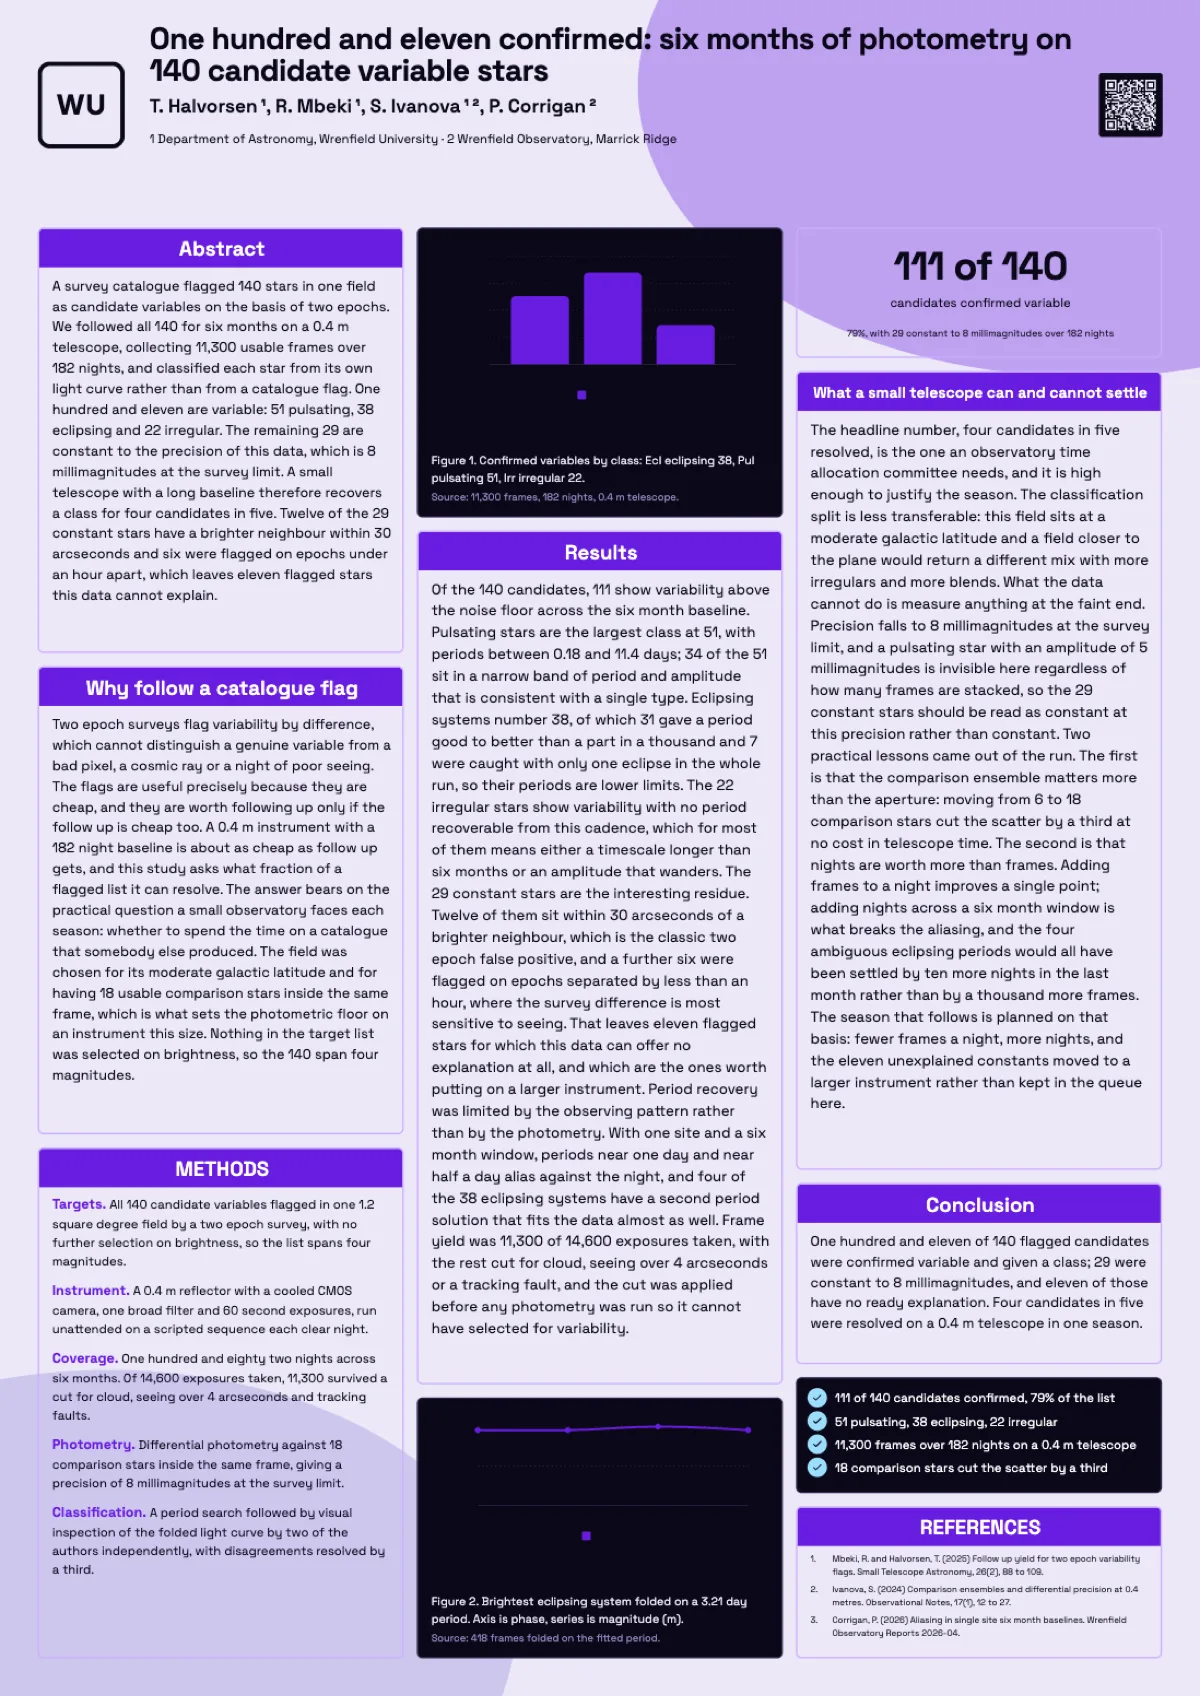
Astronomy research poster example
Six months of photometry on 140 candidate variable stars, laid out as an A0 portrait showcase board with two figures set into a three column grid. The board answers the question a small observatory asks each season: what fraction of somebody else catalogue can a 0.4 metre telescope actually resolve.
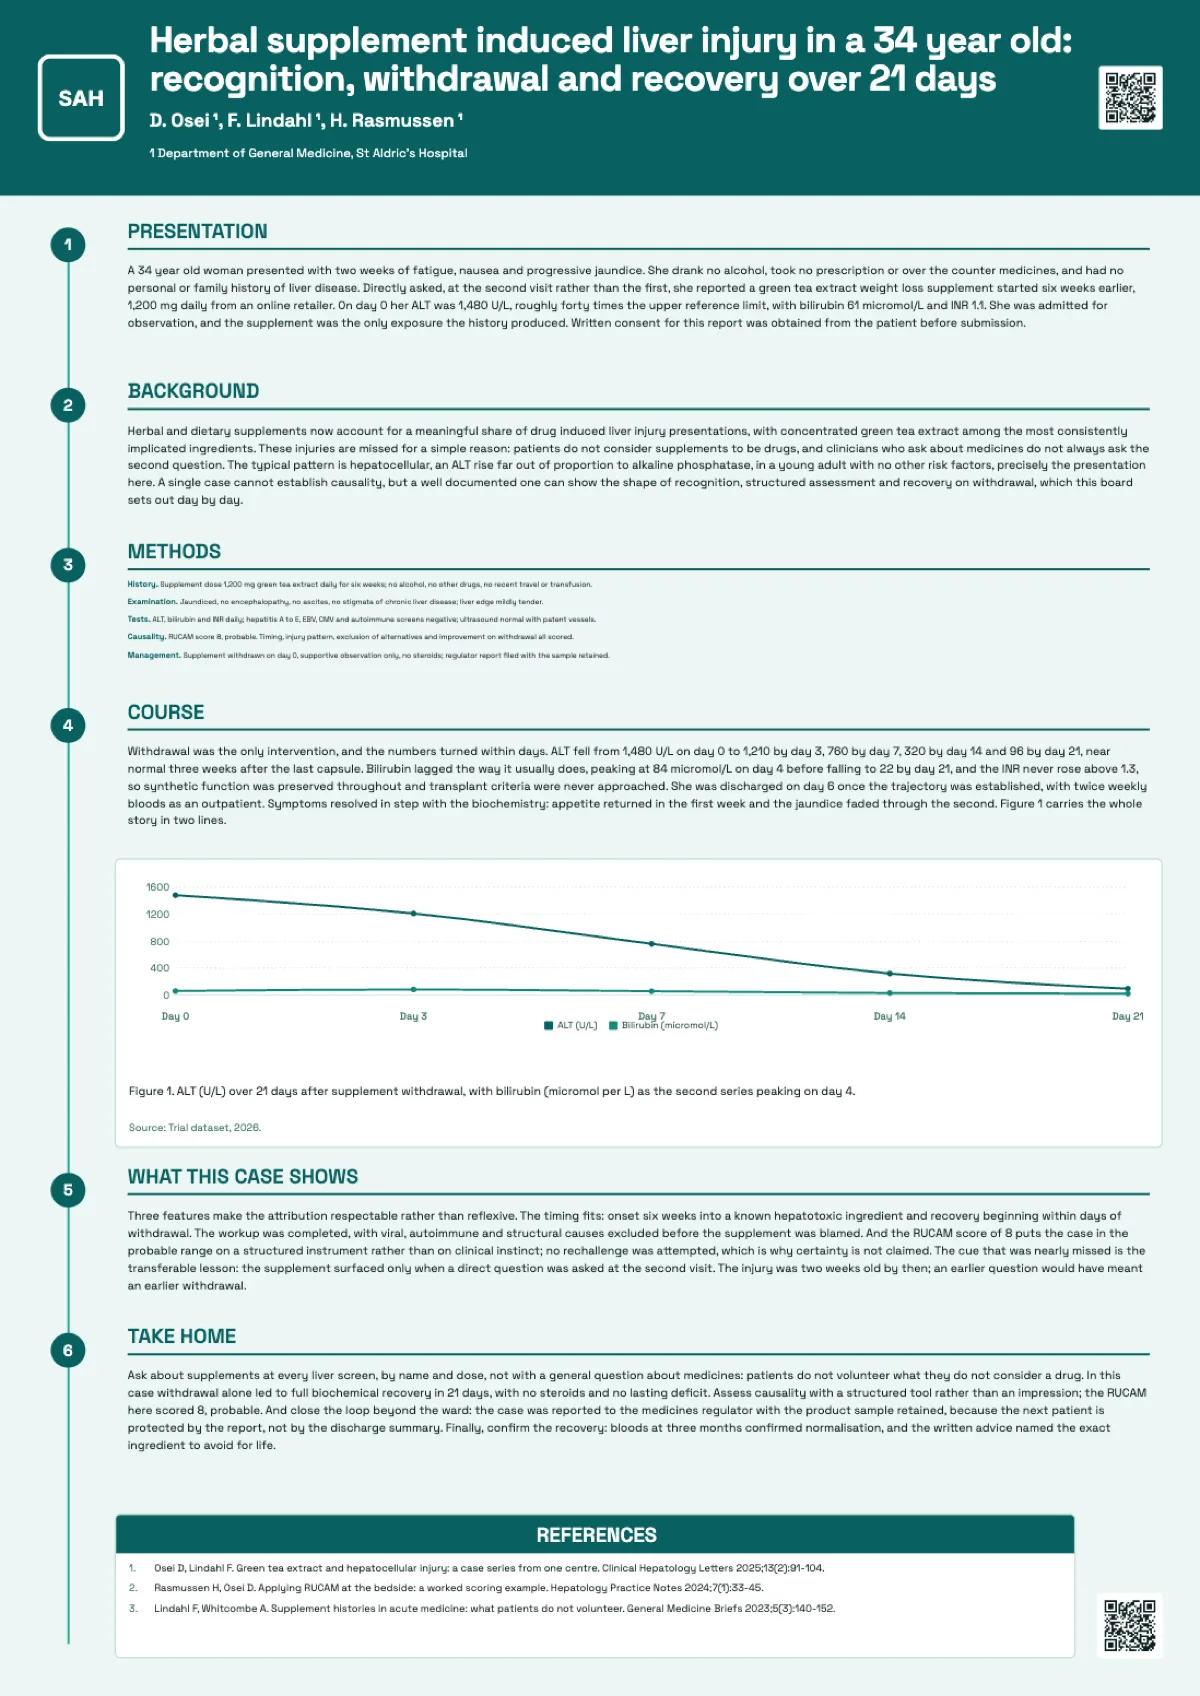
Case report poster
A case report poster is a story with laboratory values, and the layout should number the story so a reader never hunts for what happened next. This A0 portrait example runs six numbered stages down a rail, from presentation with an ALT of 1,480 to recovery at 96 by day 21, with one chart carrying the whole clinical course.
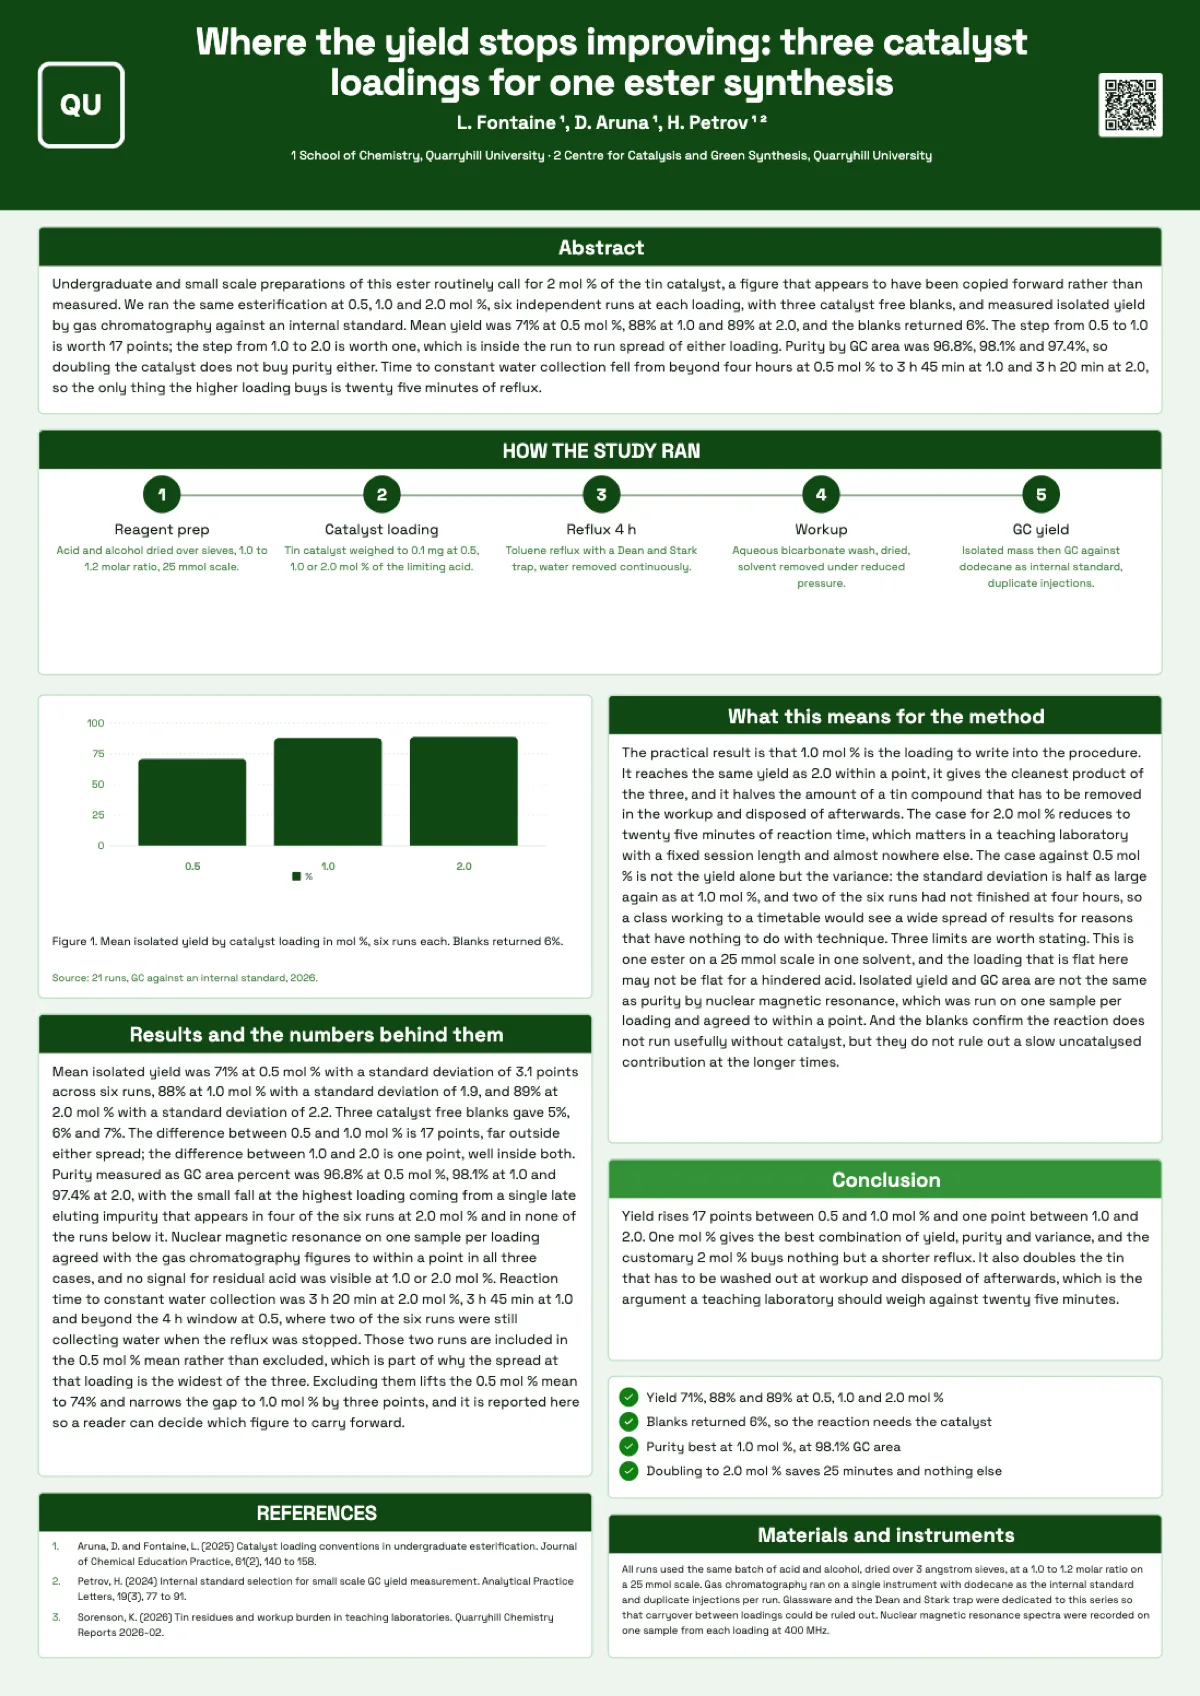
Chemistry research poster example
Three catalyst loadings for one ester synthesis, laid out as an A0 portrait board with the procedure running across the top as a five step chain. A synthetic chemistry poster is read for the method first, so the method is the first thing under the title.
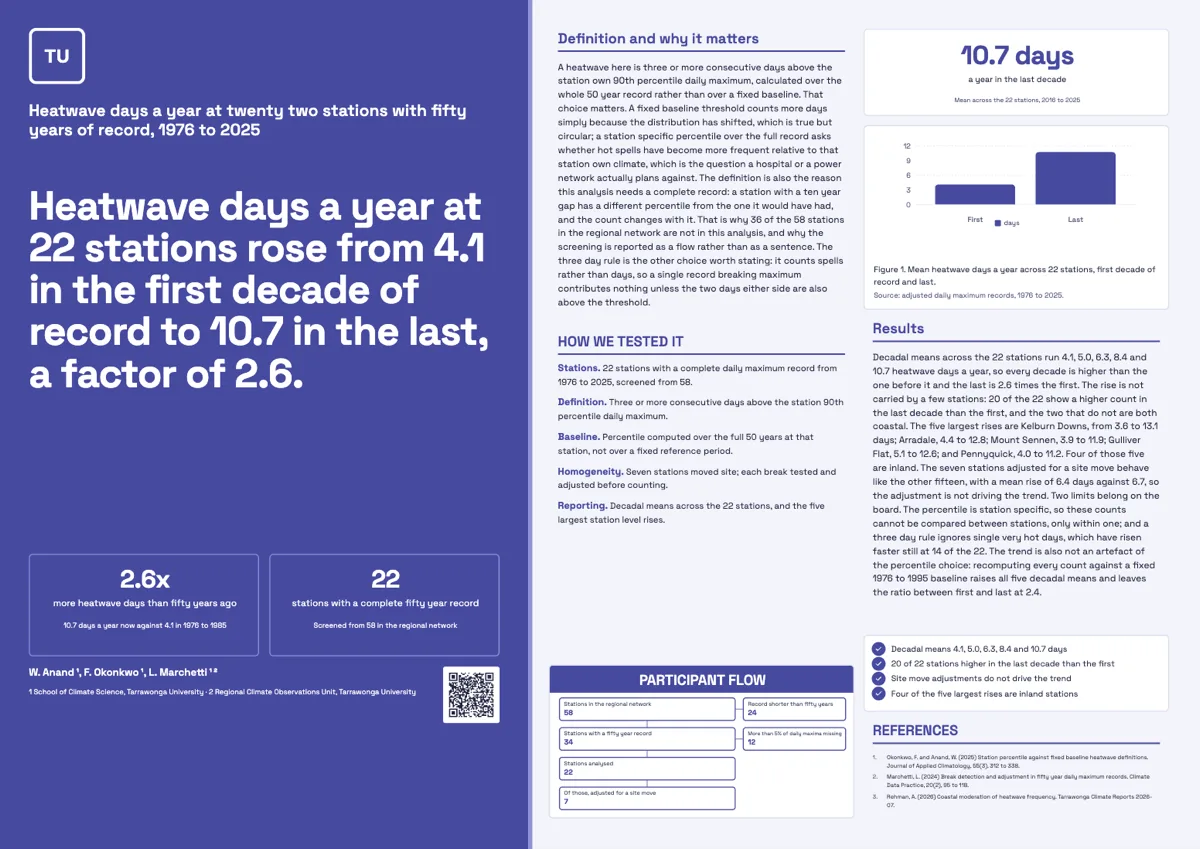
Climate science research poster example
Fifty years of heatwave days at twenty two weather stations, laid out as an A0 landscape billboard where the key finding occupies a full panel on the left. The finding is set large enough to read from across a hall, and the evidence for it runs down the right.
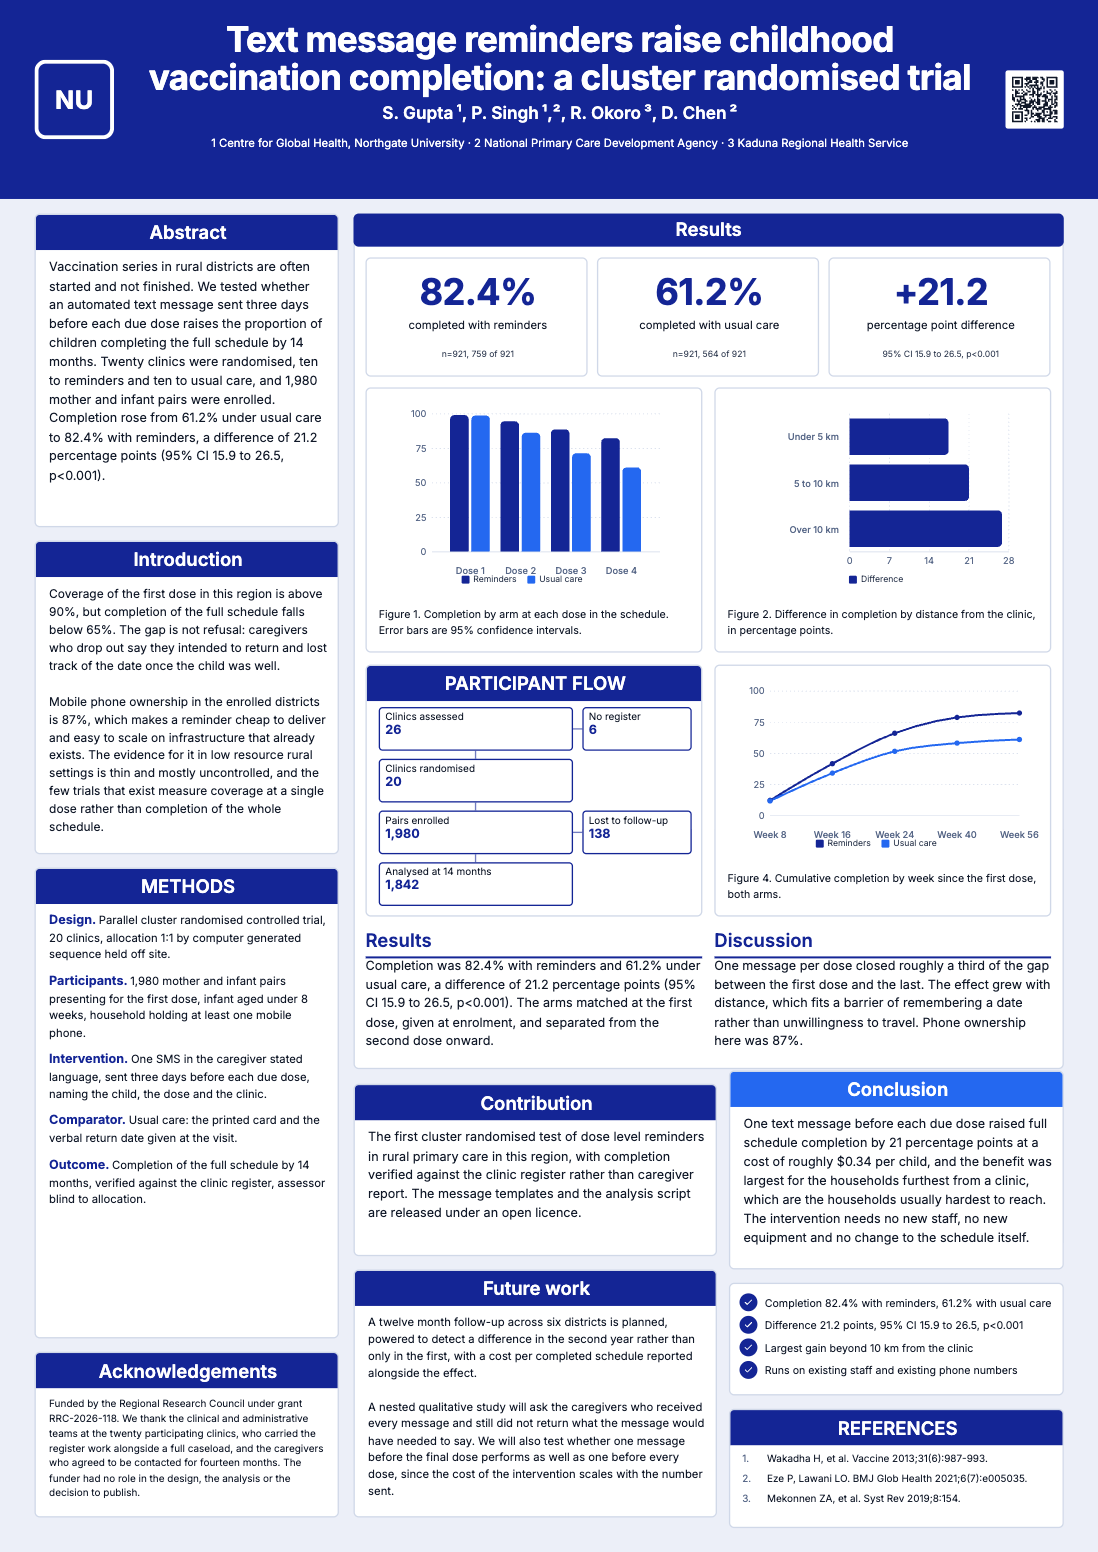
Clinical trial poster
A cluster randomised trial of text message reminders for childhood vaccination, laid out as a full A0 portrait board. Every block a trial poster is expected to carry is here and filled in: the abstract, the methods as a labelled protocol rather than a paragraph, a CONSORT participant flow whose counts reconcile, the primary outcome with its confidence interval, and three charts with numbered captions and a CONSORT flow.
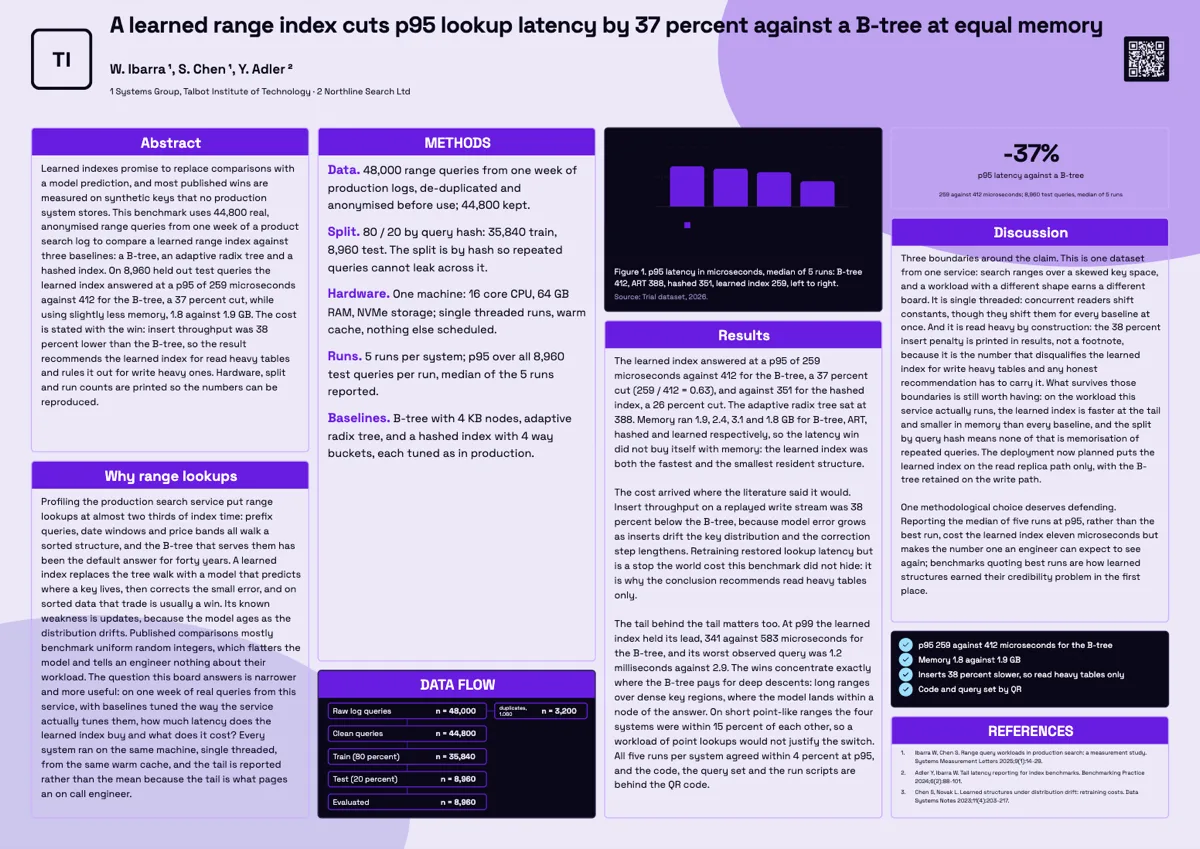
Computer science poster
A computer science poster for a systems benchmark needs three things on the board: how the test set was made, what hardware ran it, and the cost of the win beside the win. This A0 landscape example shows a learned index benchmark with its data flow reconciling from 48,000 raw queries to 8,960 evaluated, and the 38 percent insert penalty printed in results.
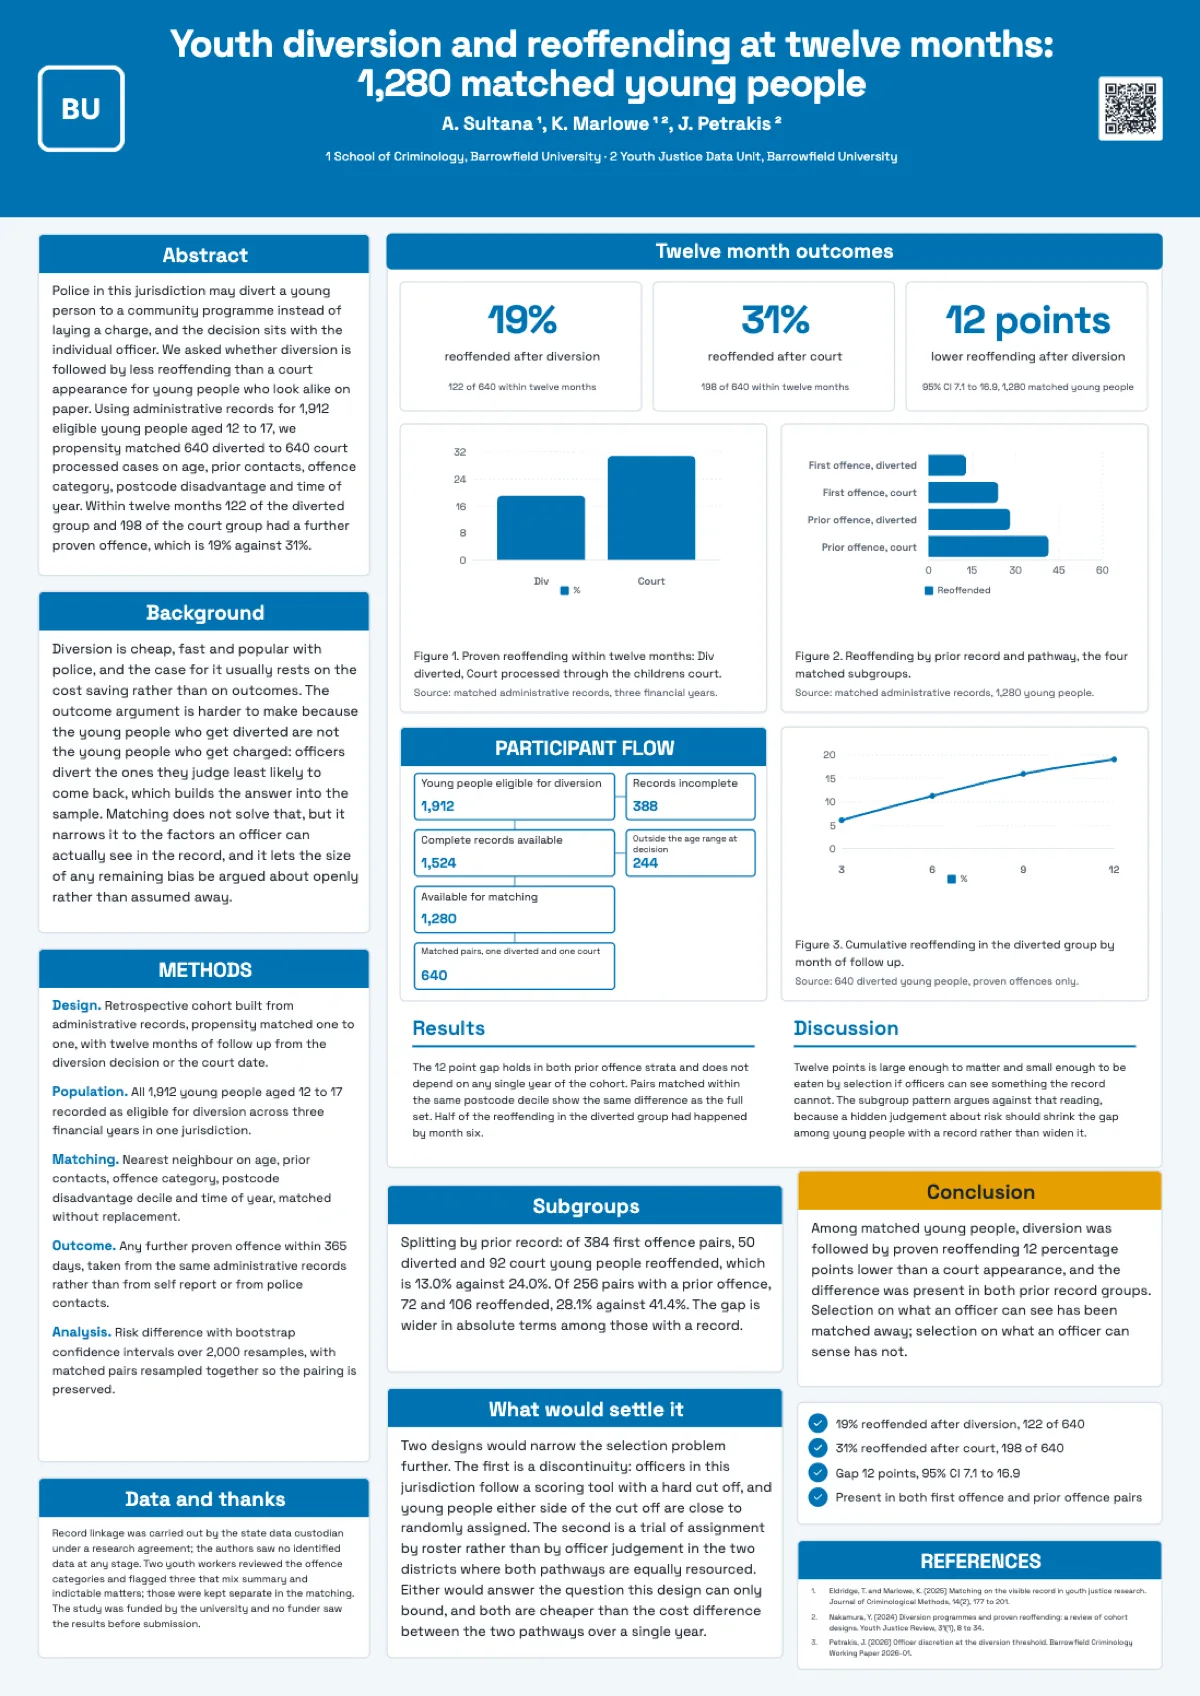
Criminology research poster example
A matched cohort study of youth diversion and twelve month reoffending, laid out as a classic A0 portrait research board. Three key numbers sit across the top of the results, and every one of them can be traced back to a count in the flow below.
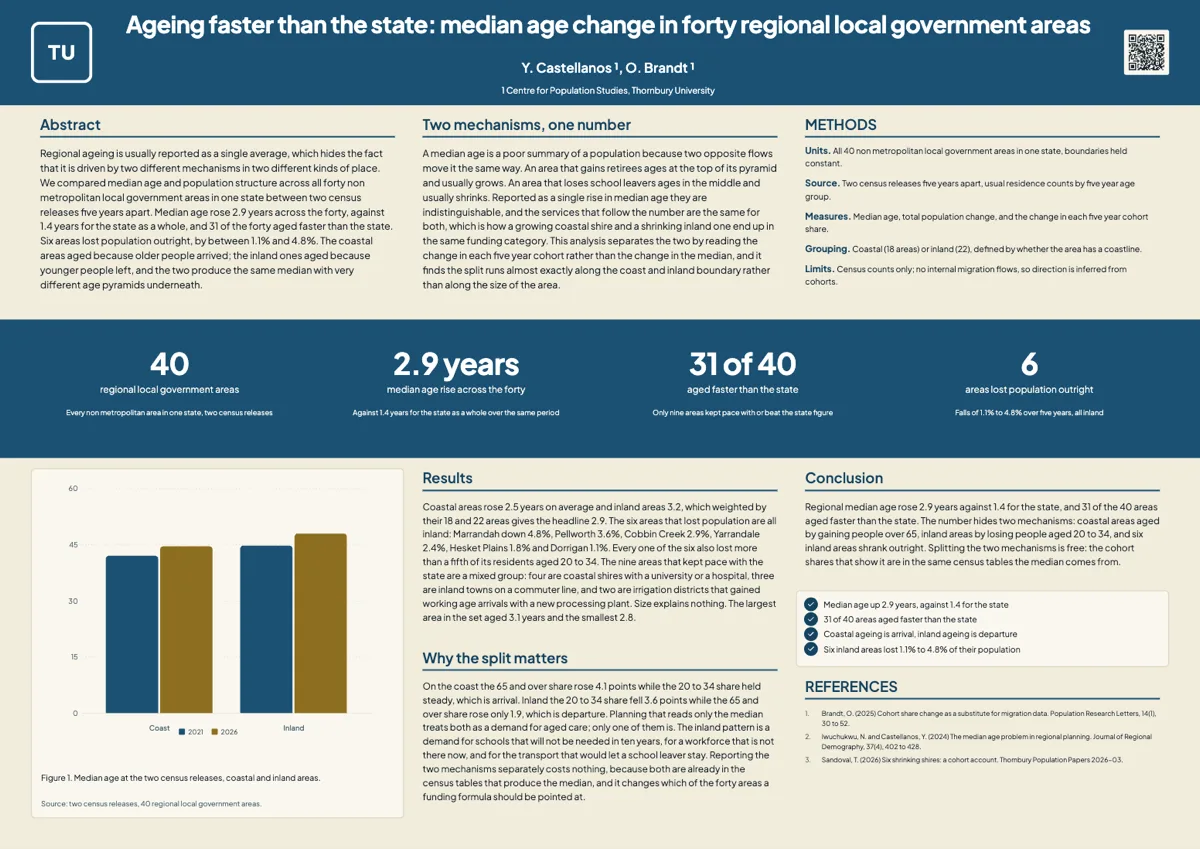
Demography research poster example
Median age change across forty regional local government areas, laid out as an A0 landscape board with a ribbon of four numbers running across the middle. The ribbon holds the result and the columns above and below explain why one number hides two different mechanisms.
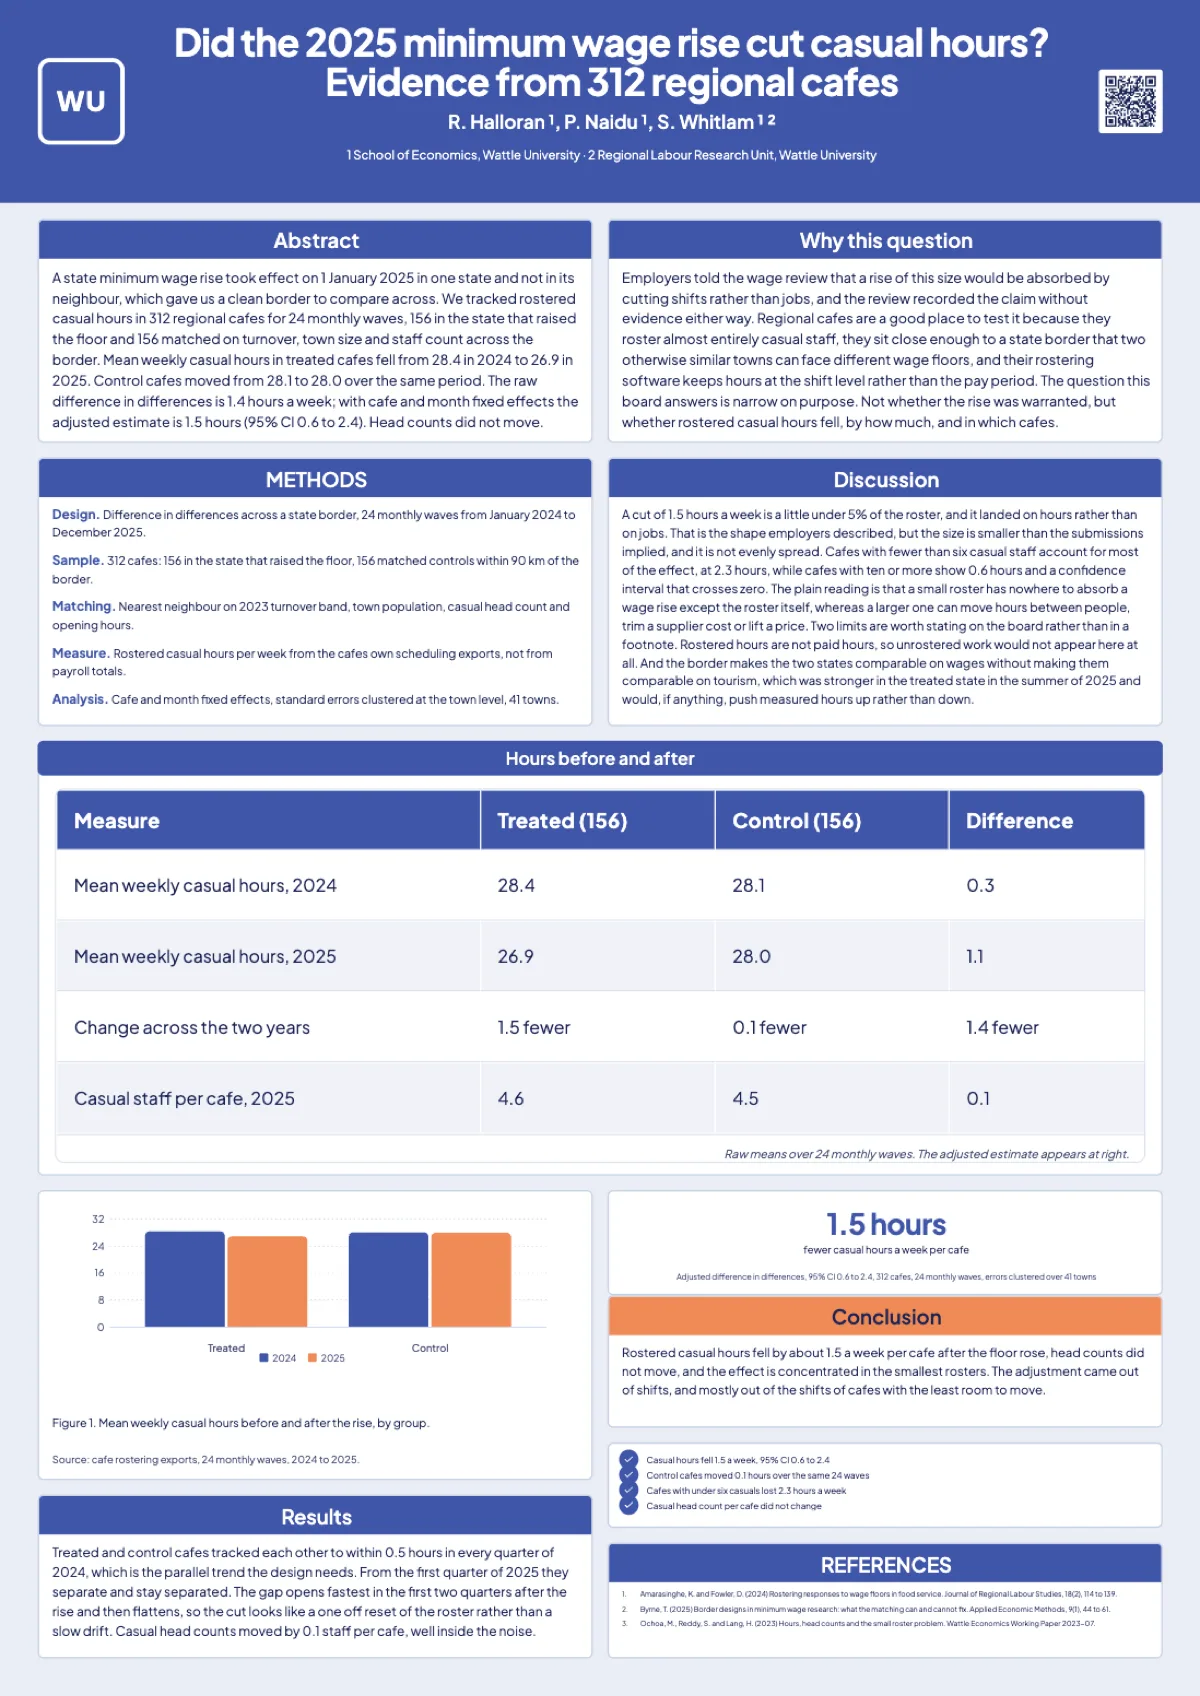
Economics research poster example
A difference in differences study of a state minimum wage rise, laid out as an A0 portrait board built around its results table. At a metre you read the estimate, the table under it and the interval, and only then the method that produced them.
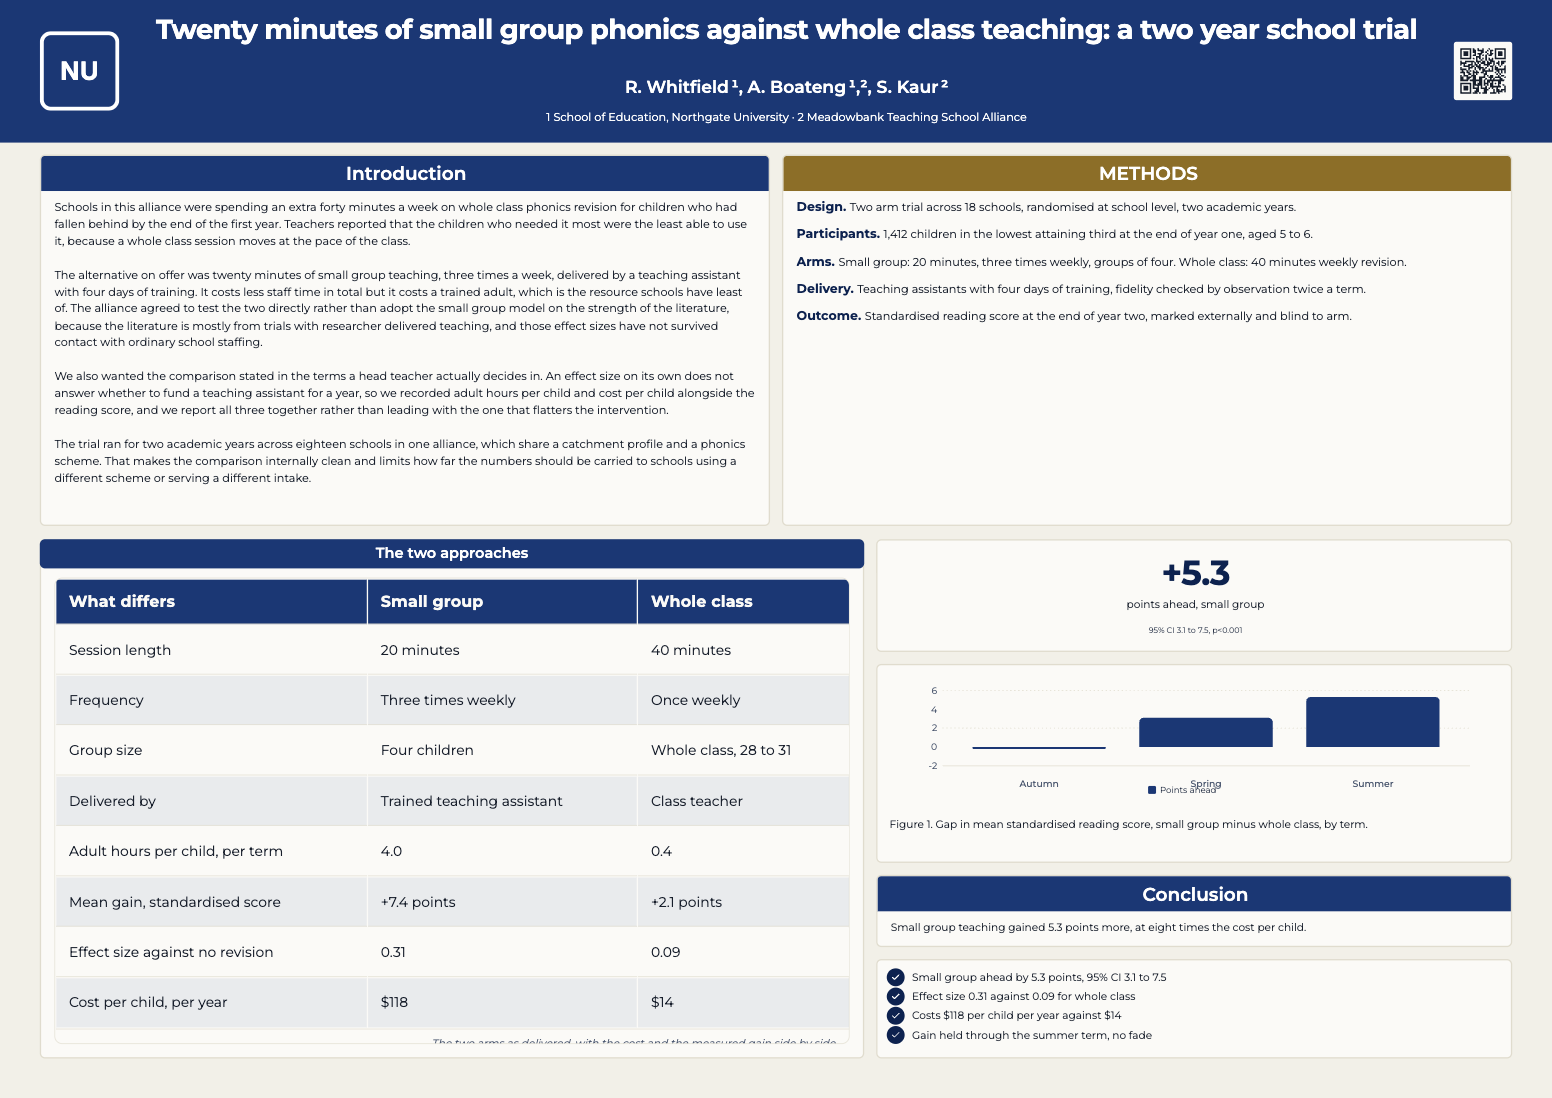
Education research poster
A two year school trial comparing twenty minutes of small group phonics against whole class revision, laid out as an A0 landscape board built around a comparison table. It reports the reading gain, the adult hours and the cost per child together, because those are the three numbers a head teacher decides with.
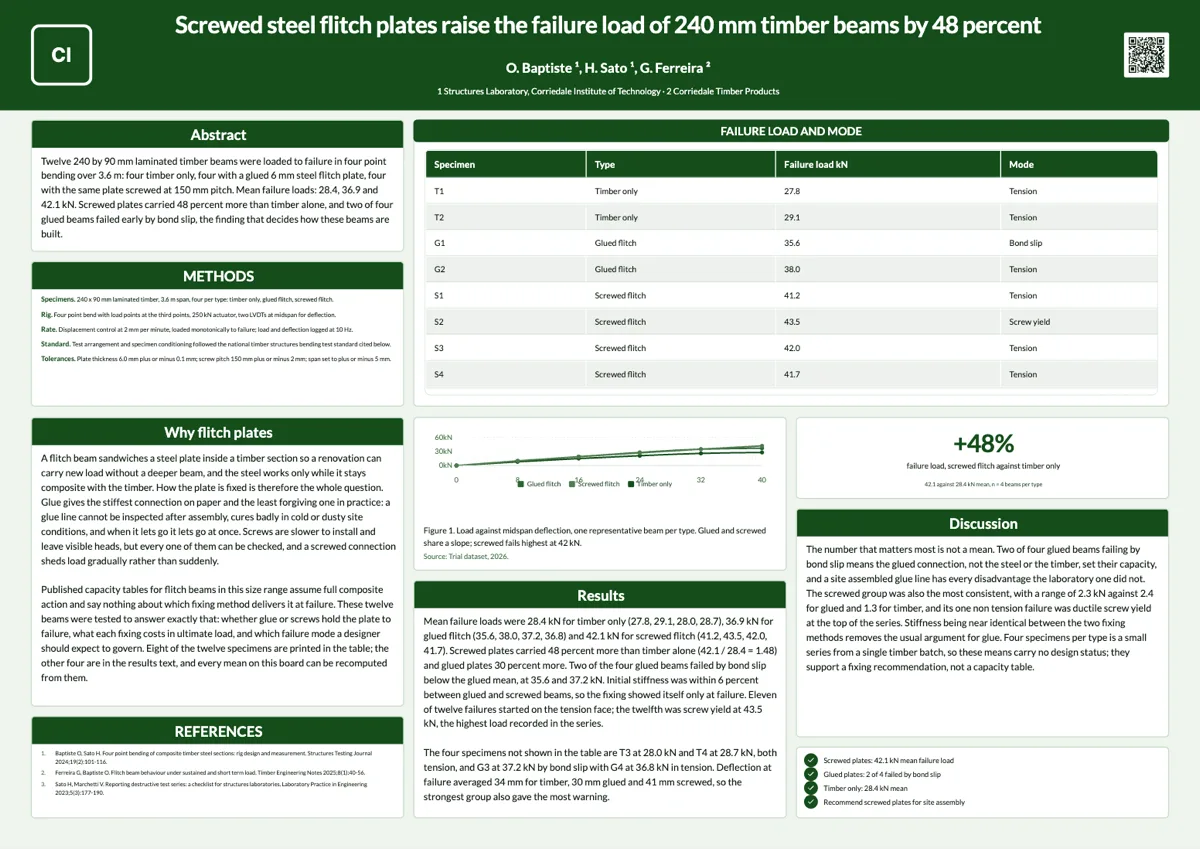
Engineering test poster
An engineering poster is read the way a test report is read: rig, standard, tolerances, then the table of what broke and how. This A0 landscape example puts eight of twelve beam specimens in a failure load table, one load against deflection curve per beam type, and the plate and screw tolerances in the methods block.
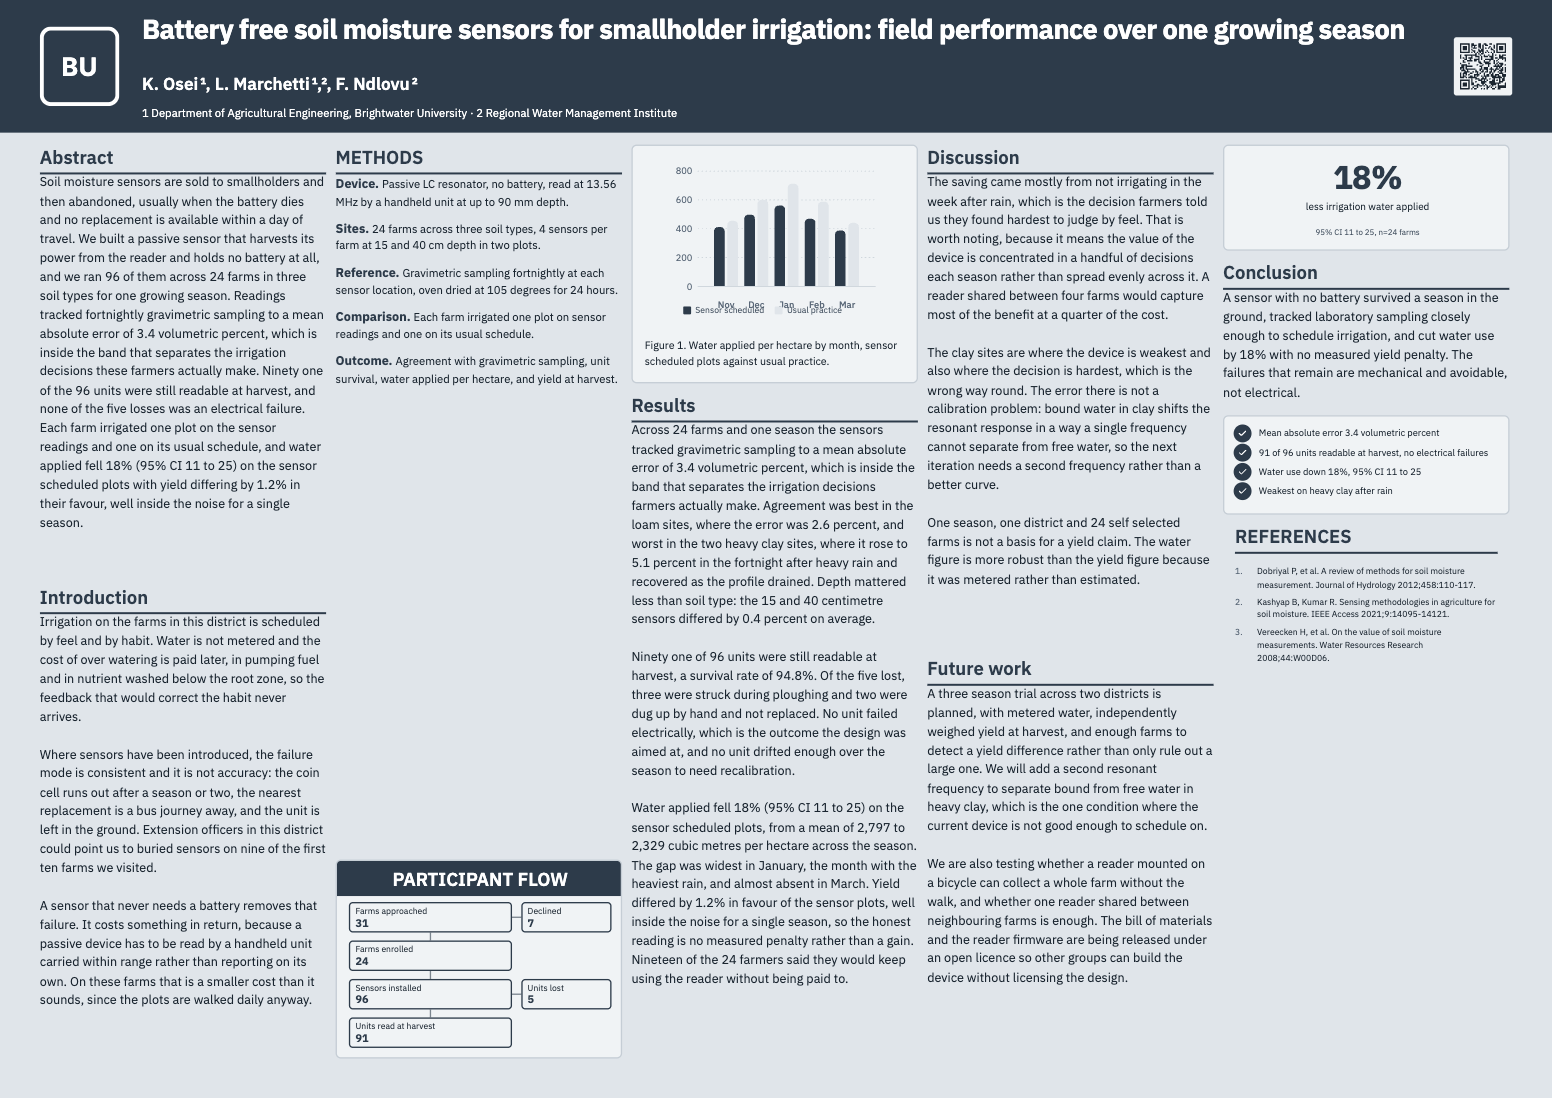
Environmental science poster
A season of battery free soil moisture sensors on 24 smallholder farms, laid out as an A0 landscape broadsheet. It is a field trial rather than a laboratory study, so the board reports the things field work actually turns on: whether the device survived, where it was weakest, and what it saved.
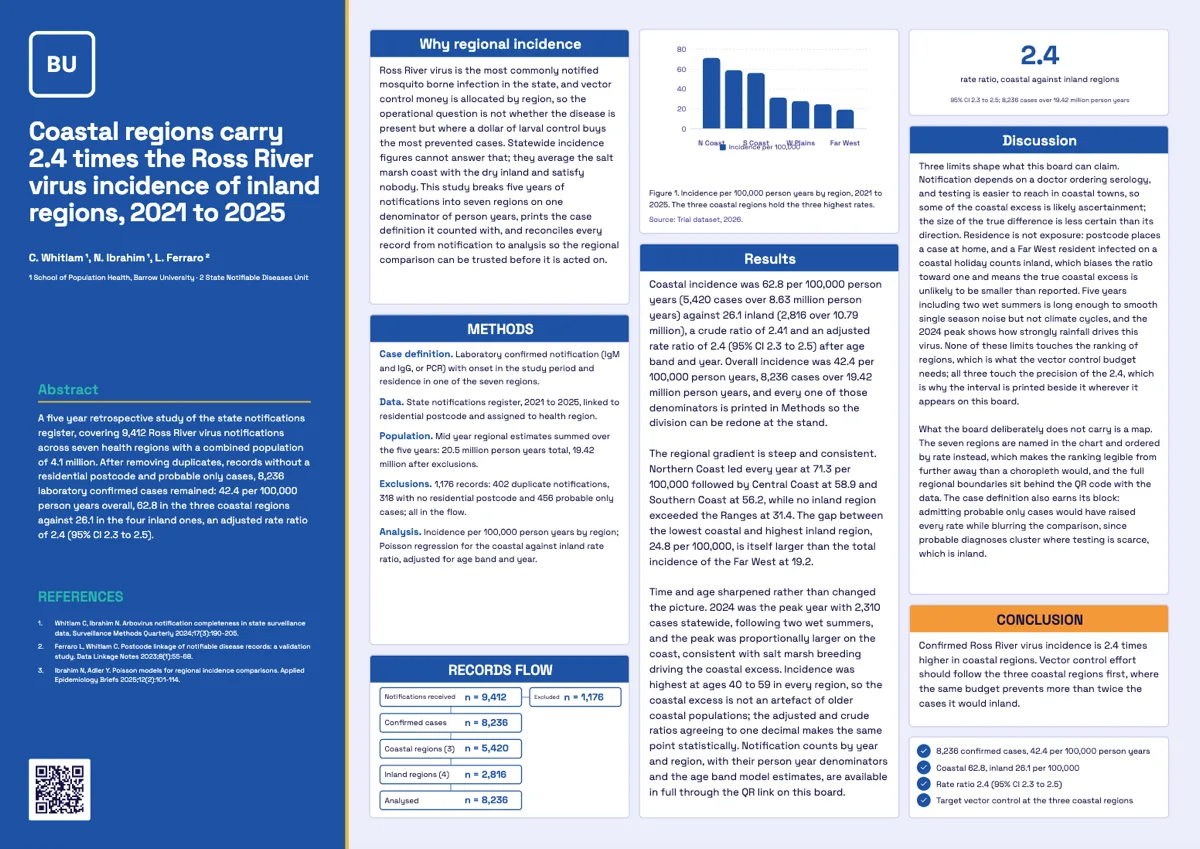
Epidemiology poster
An epidemiology poster has three obligations: print the case definition, reconcile the records flow, and put the denominators where a reader can redo the division. This A0 landscape example does all three for a fictional five year Ross River virus registry study, with incidence by region in one chart and a rate ratio of 2.4 as the key number.
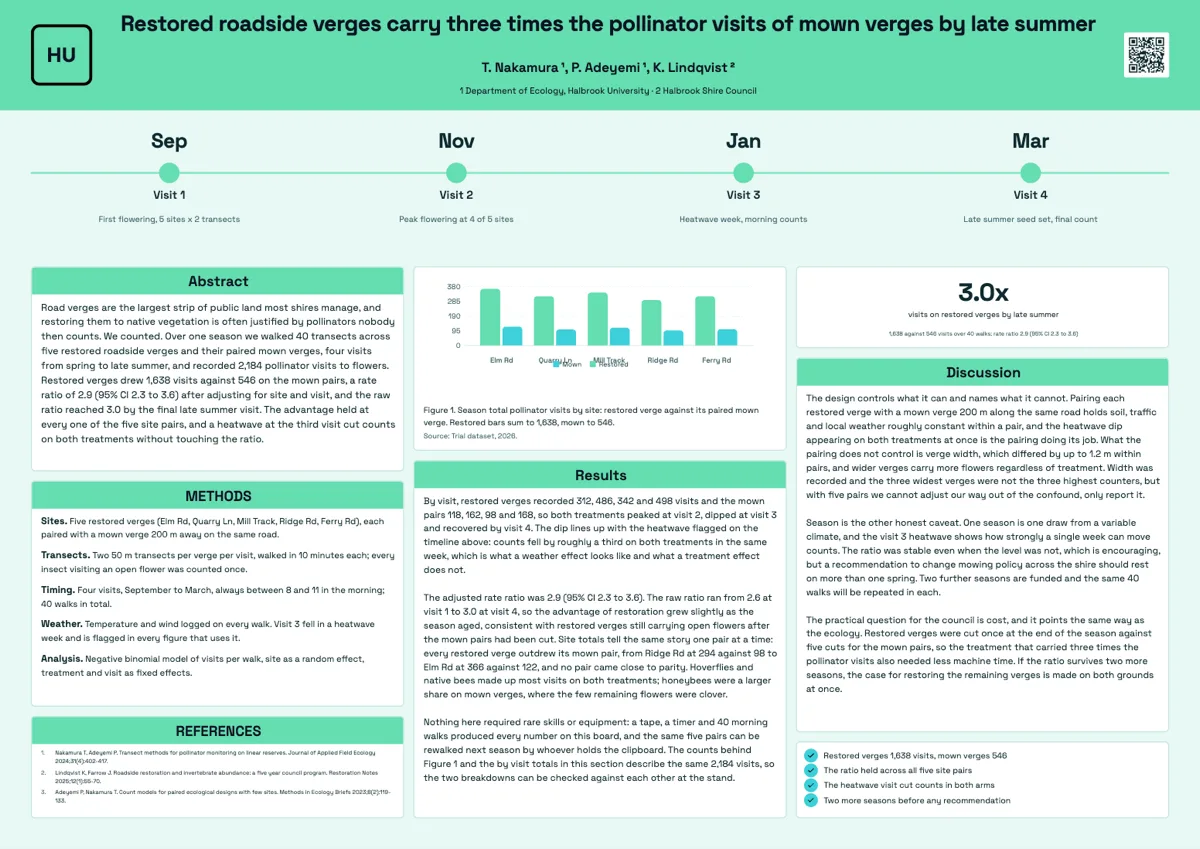
Field study poster
A field study poster has to show when and where every number was collected, because season and site are the confounders a reviewer checks first. This A0 landscape example runs its four sampling visits as a dated timeline across the top of the board, so the heatwave at visit three explains the dip in the counts before anyone asks.
Geology research poster example
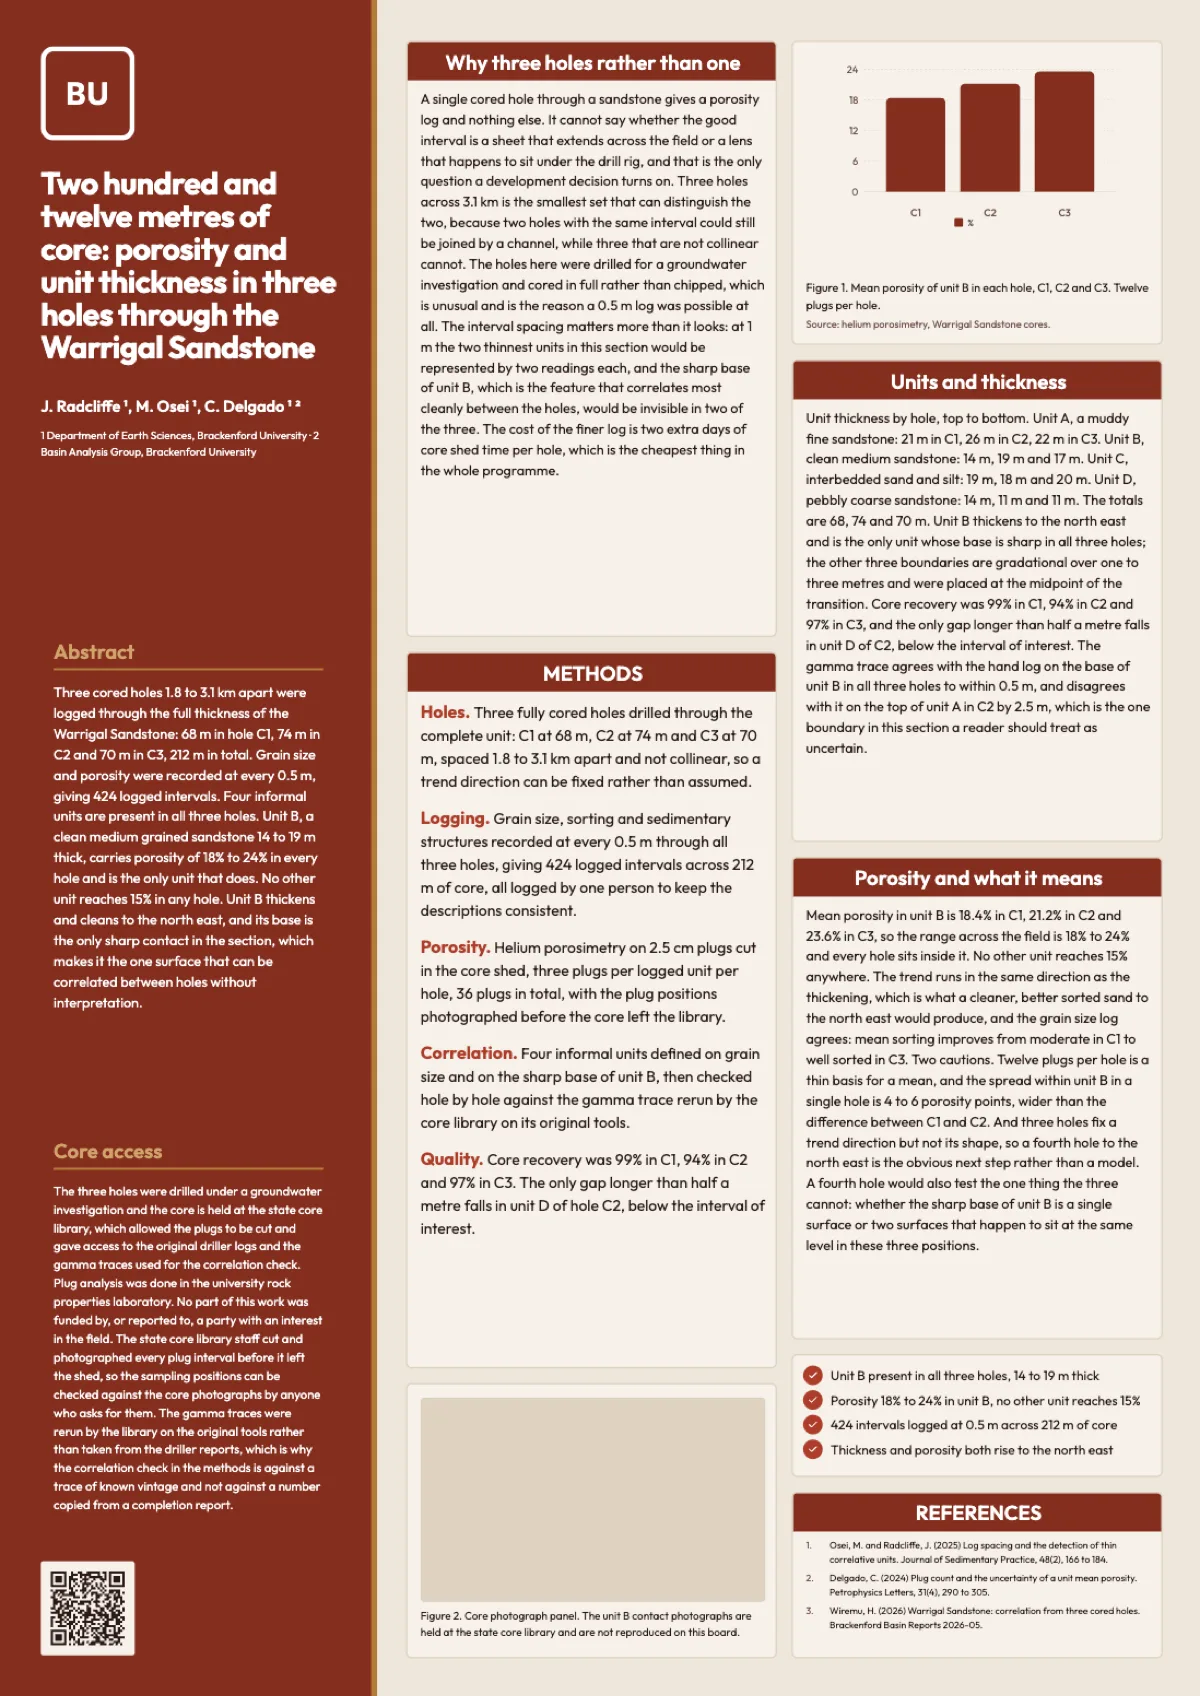
Three drill cores through one sandstone unit, laid out as an A0 portrait board with a coloured sidebar rail carrying the title, abstract and core access note. The rail keeps the identity of the board on the left and leaves the full right hand column for the logs and the analysis.
Health economics poster
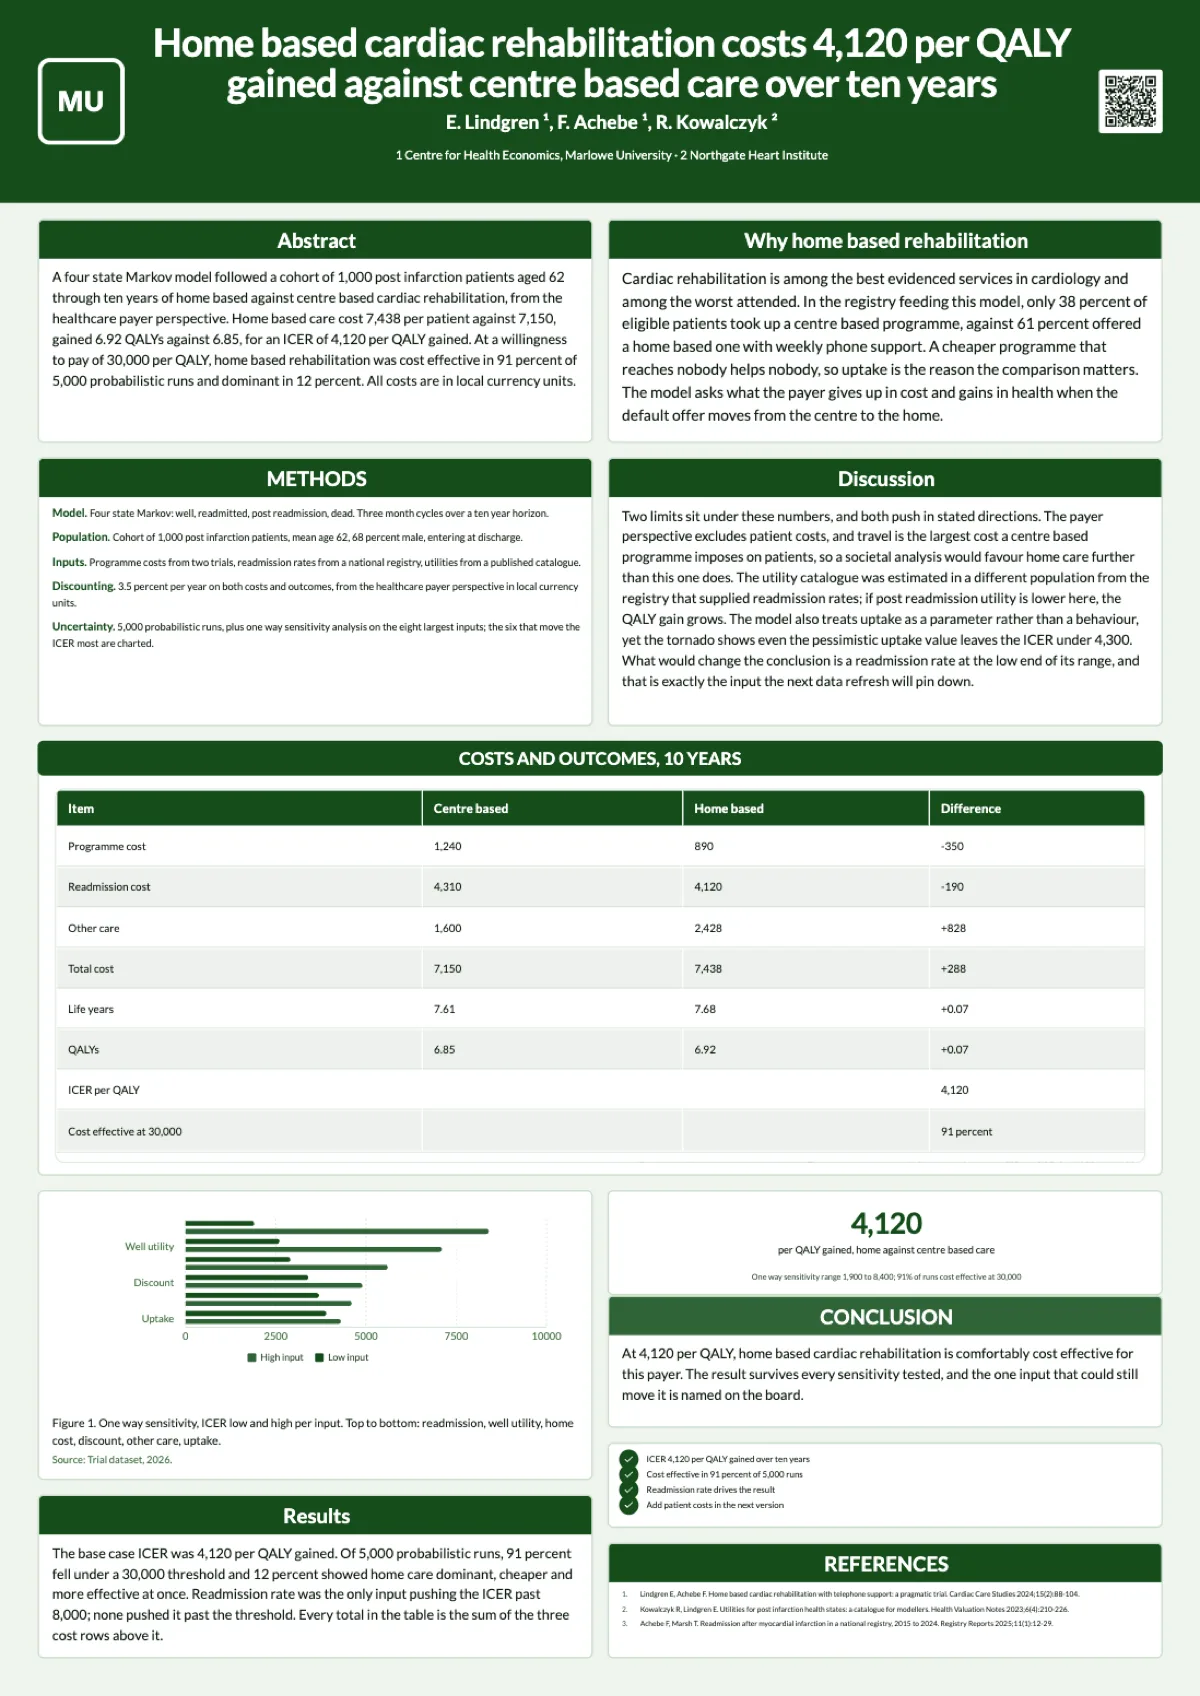
A health economics poster stands or falls on whether its table adds up and its uncertainty is on the board rather than in the appendix. This A0 portrait example carries a cost and QALY table whose totals are the sums of their rows, an ICER of 4,120 per QALY as the key number, and a tornado chart showing which input moves it.
Human geography research poster example
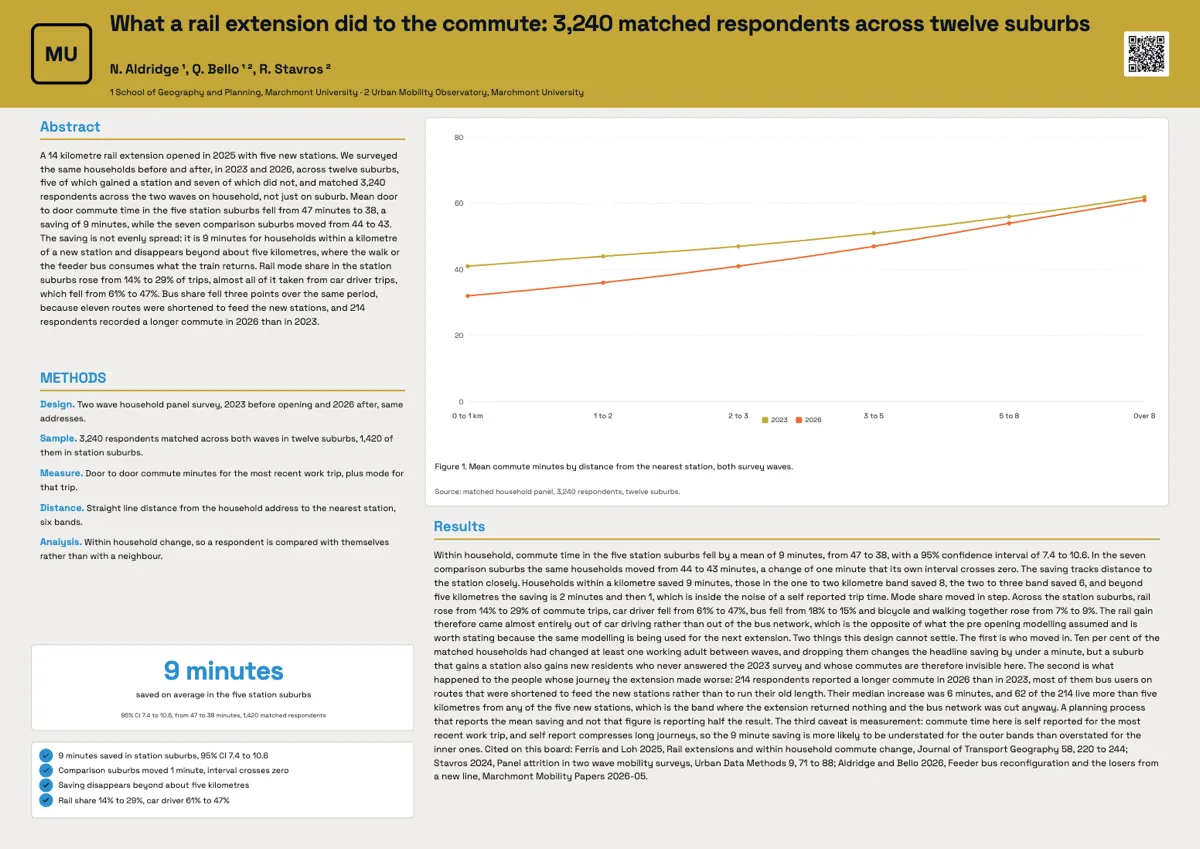
A two wave household panel measuring what a rail extension did to the commute, laid out as an A0 landscape board with one wide hero figure. The figure plots commute time against distance from the nearest station, so the saving and the point where it disappears are both visible at once.
Hydrology research poster example
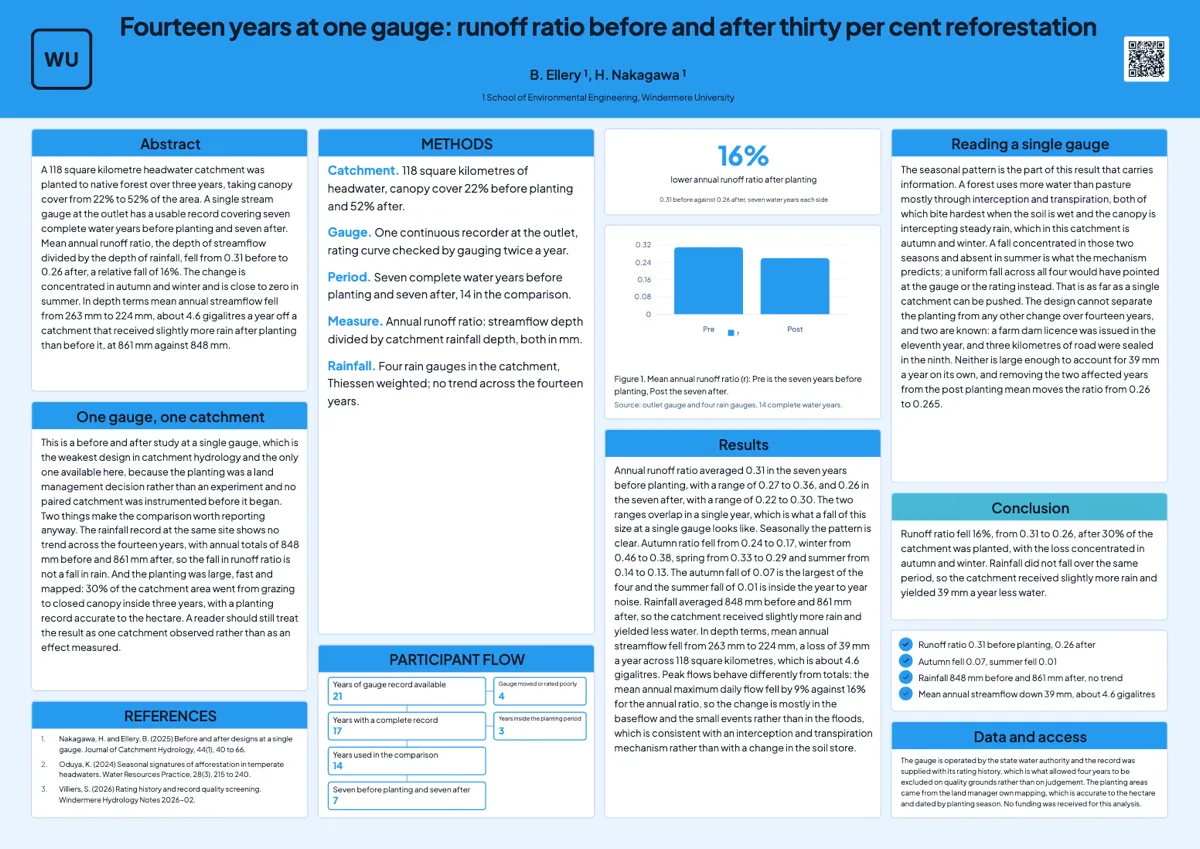
Runoff ratio at one catchment gauge before and after thirty per cent reforestation, laid out as a four column A0 landscape board. Each column takes one stage of the argument, so a reader moves left to right from the question to the limits without doubling back.
Lab research poster
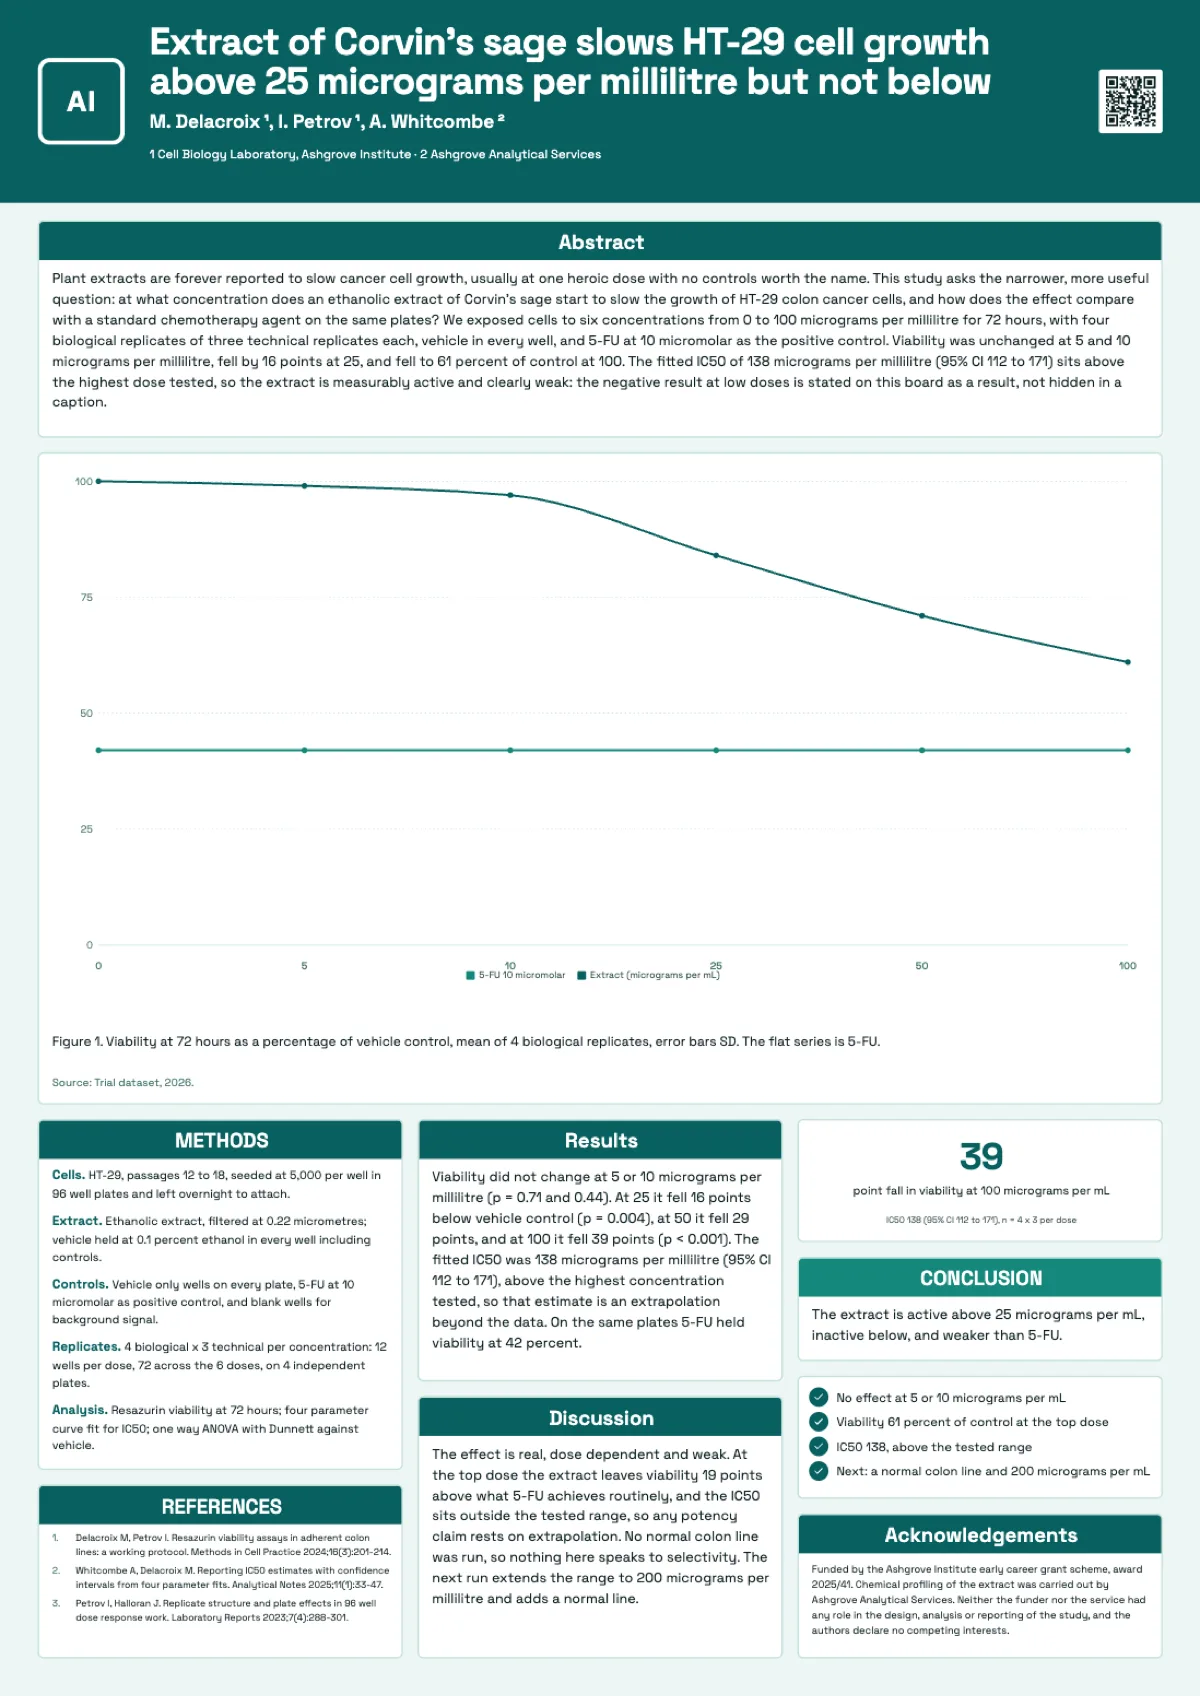
A lab research poster earns trust with its controls, its replicate counts and its willingness to print the doses where nothing happened. This A0 portrait example gives one dose response line chart most of the canvas, states the null results at 5 and 10 micrograms per millilitre as findings, and keeps the positive control on the same axes.
Legal research poster example
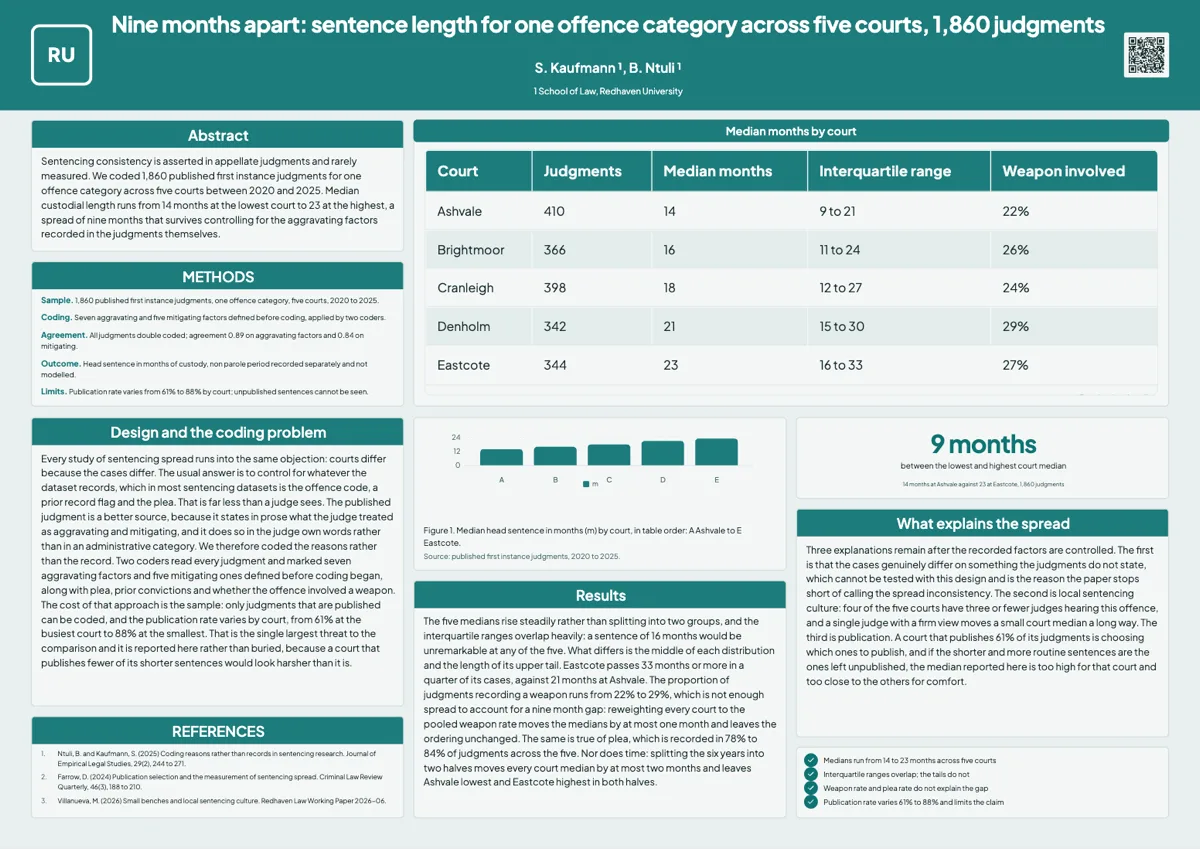
Sentence length for one offence category across five courts, laid out as an A0 landscape board with the table given the widest block on the design. Empirical legal work is read through its table, so the table is placed where the eye lands first.
Linguistics research poster example
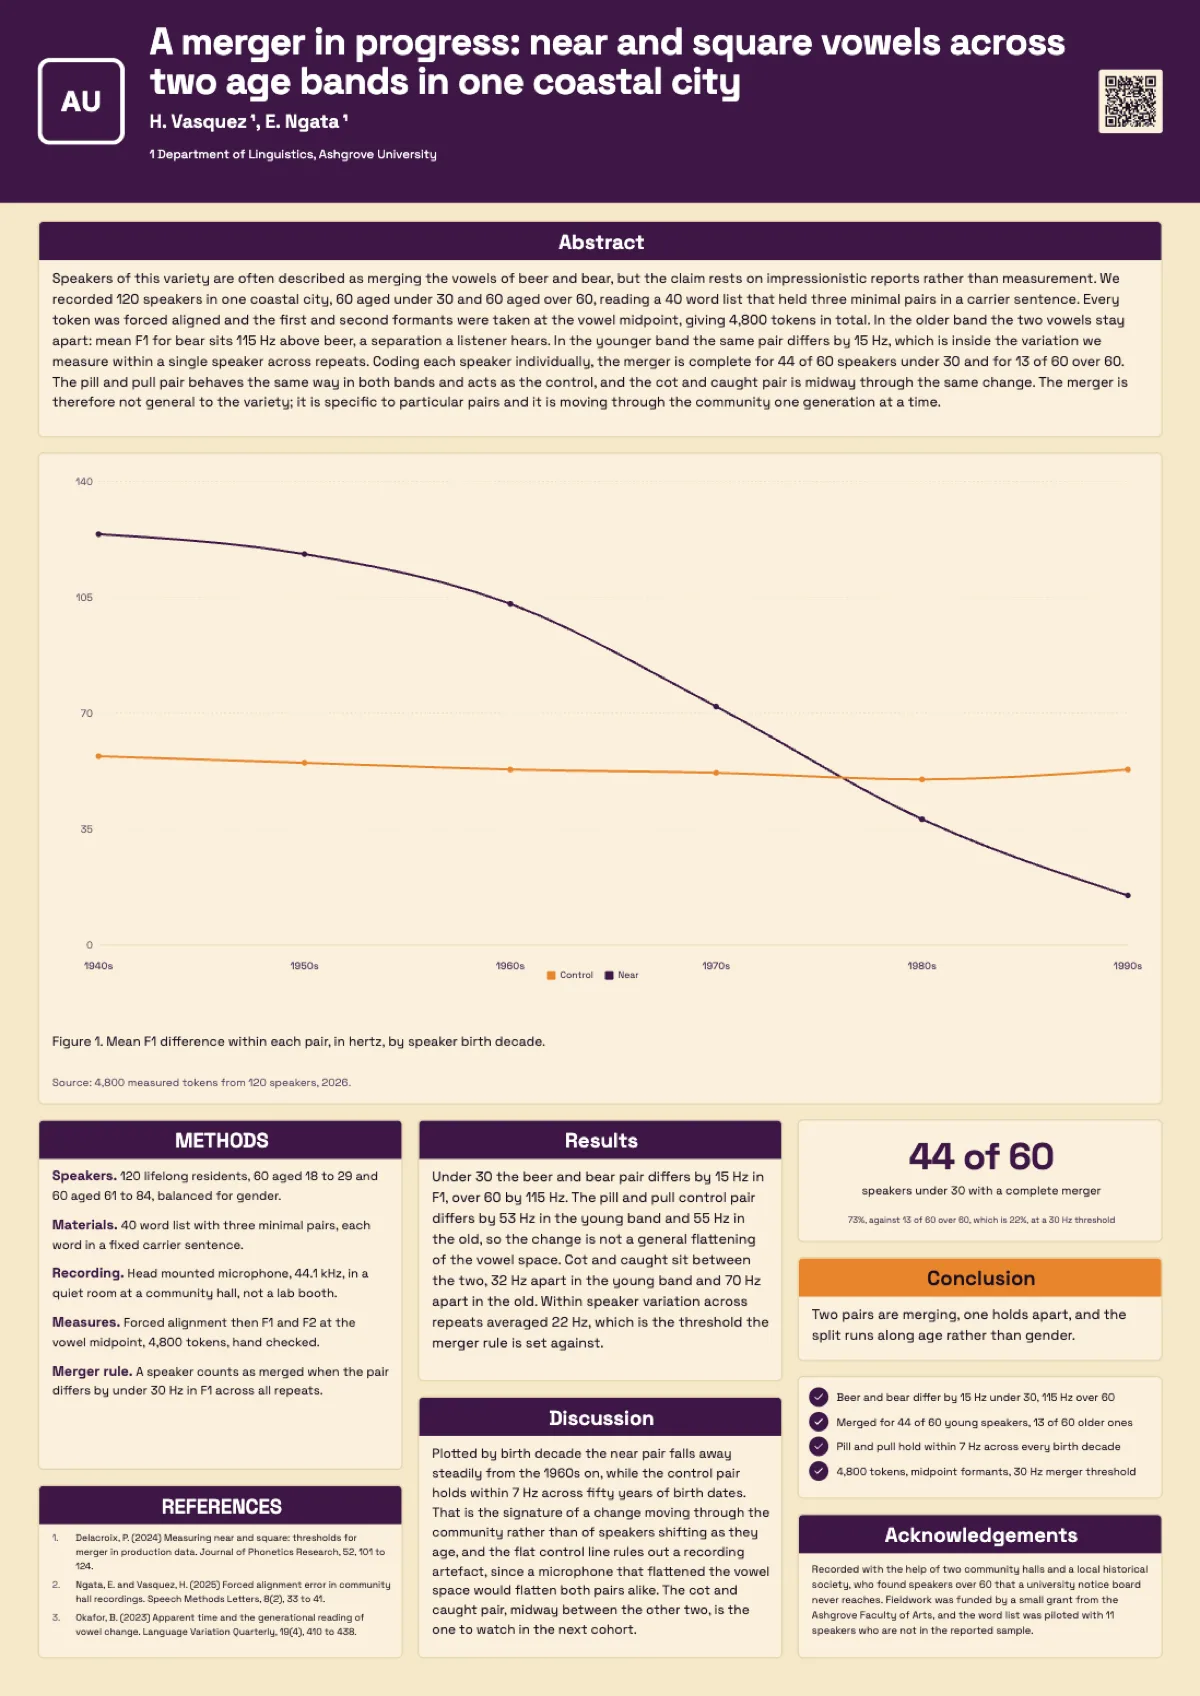
A vowel merger measured across 120 speakers in one coastal city, laid out as an A0 portrait board where a single hero figure takes the top half. The figure plots formant difference by birth decade, so the change reads as a trend rather than as two bars.
Machine learning research poster
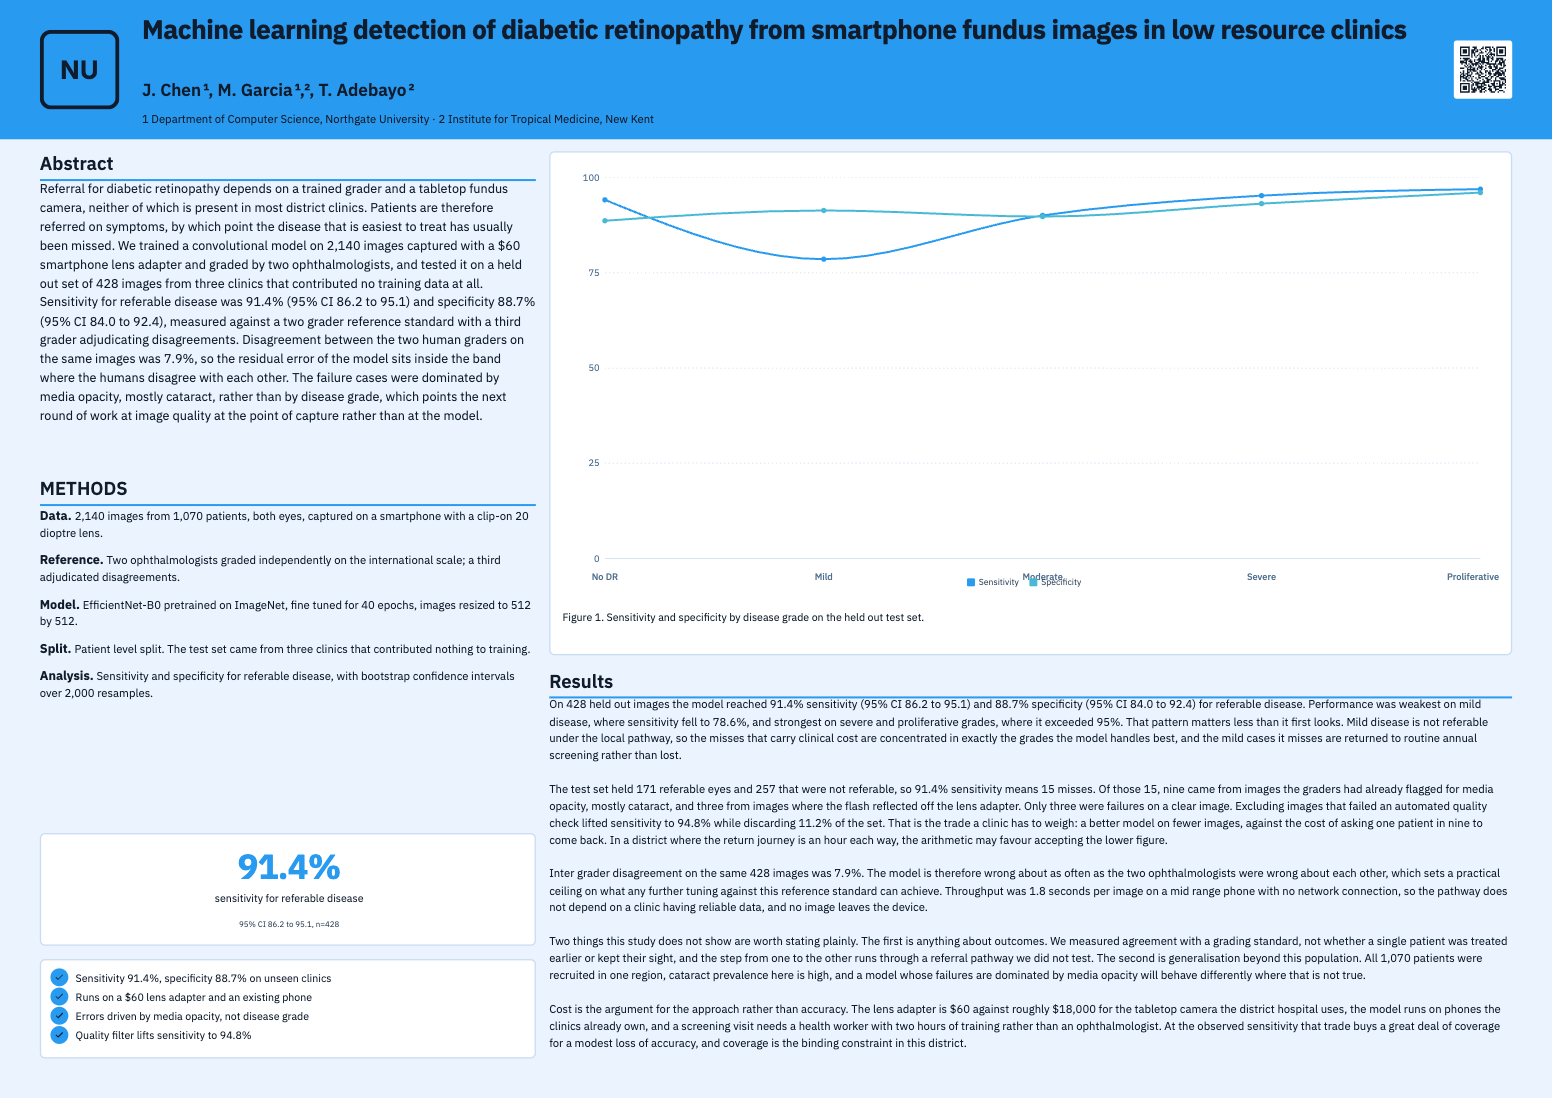
A model that detects diabetic retinopathy from smartphone fundus images, laid out as an A0 landscape board. It is built around the figure, which is what a machine learning poster usually needs, and the text does the two things these posters most often skip: it describes the split honestly, and it says plainly what the result does not show.
Build a poster from your own study
Paste what your study did and found, pick A0 portrait or landscape, and the generator writes every section and fills the charts and the participant flow from your numbers.
Make a poster