Poster examples
Research posters, block by block
Every poster here is a whole A0 board, read the way a conference reader reads one: the finding first, then the abstract, the method as a labelled protocol, the figures with their captions, and the references. The studies are invented, the structure is how the field actually writes them.
80 examples, page 4 of 4
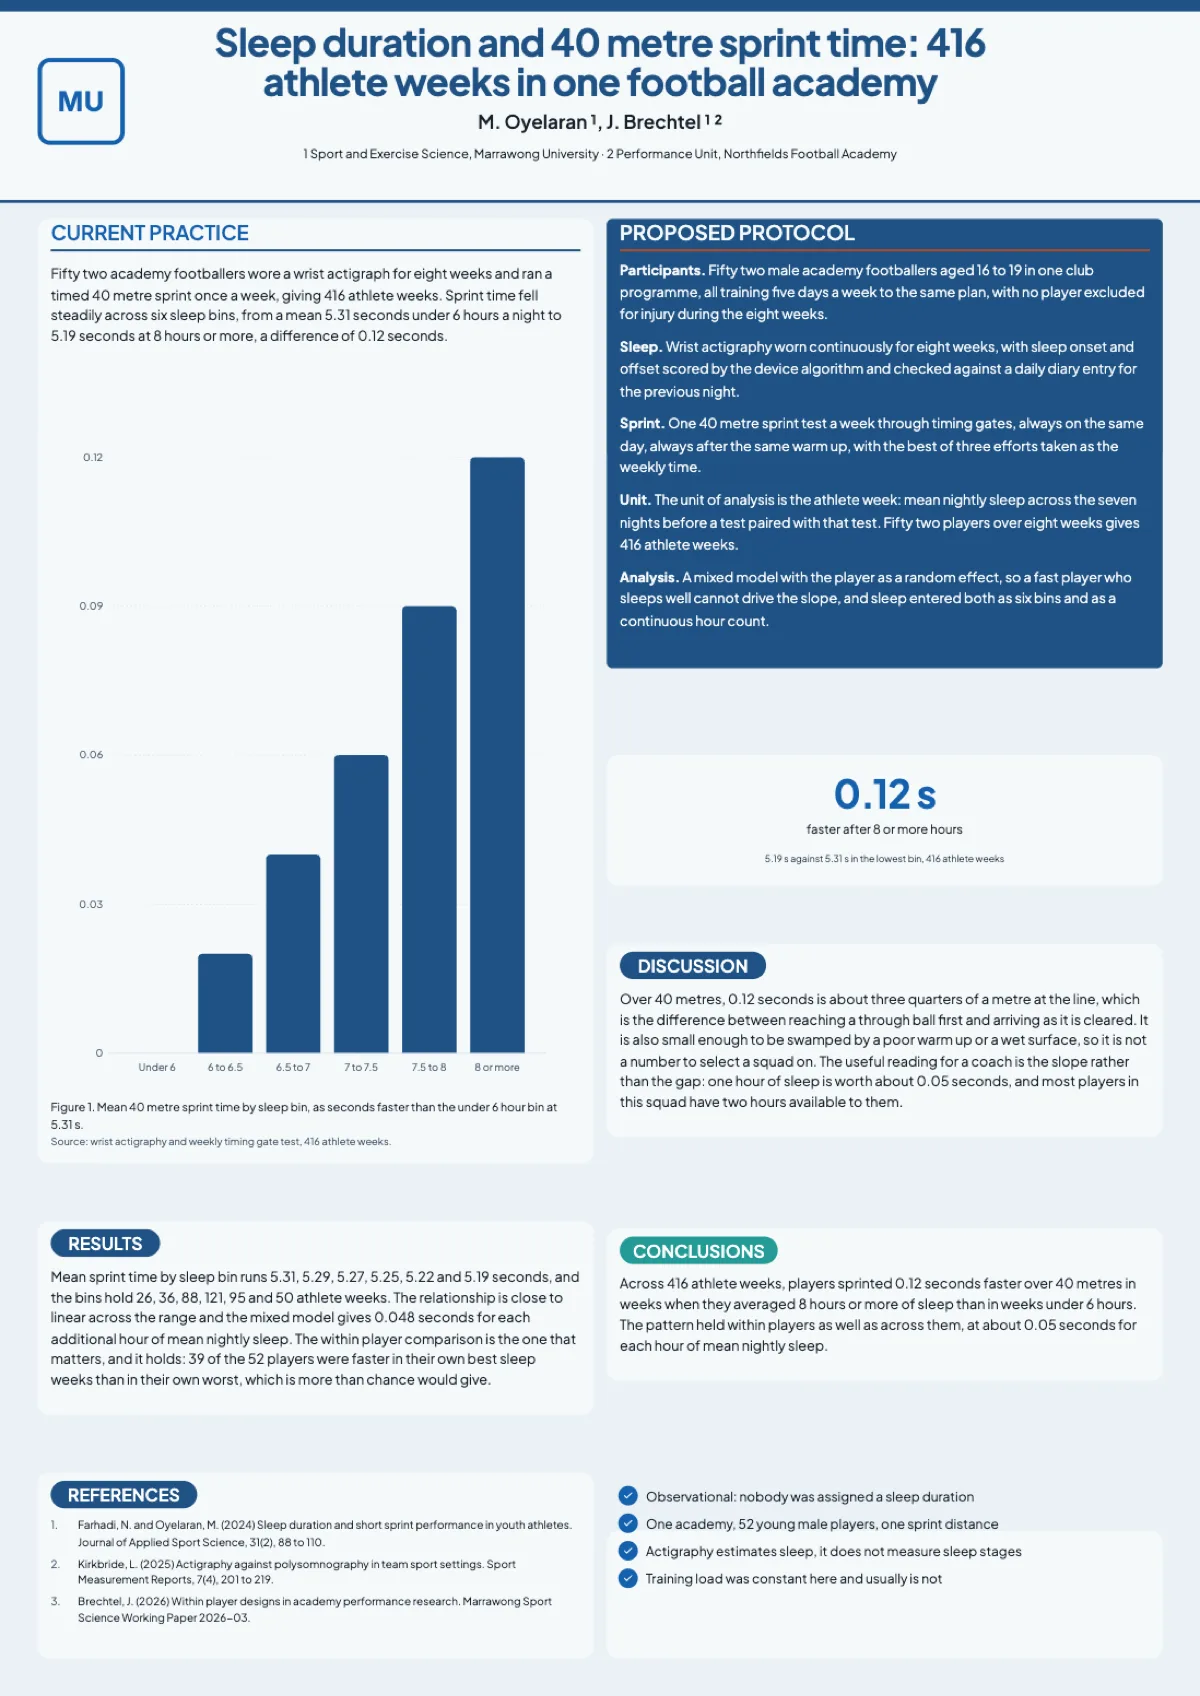
Sports science research poster example
A sports science board is usually built around one figure, because a coach standing at it wants the gradient before the method. This poster gives the whole top half to sleep against 40 metre sprint time across 416 athlete weeks, then explains underneath what 0.12 seconds is worth on the pitch.
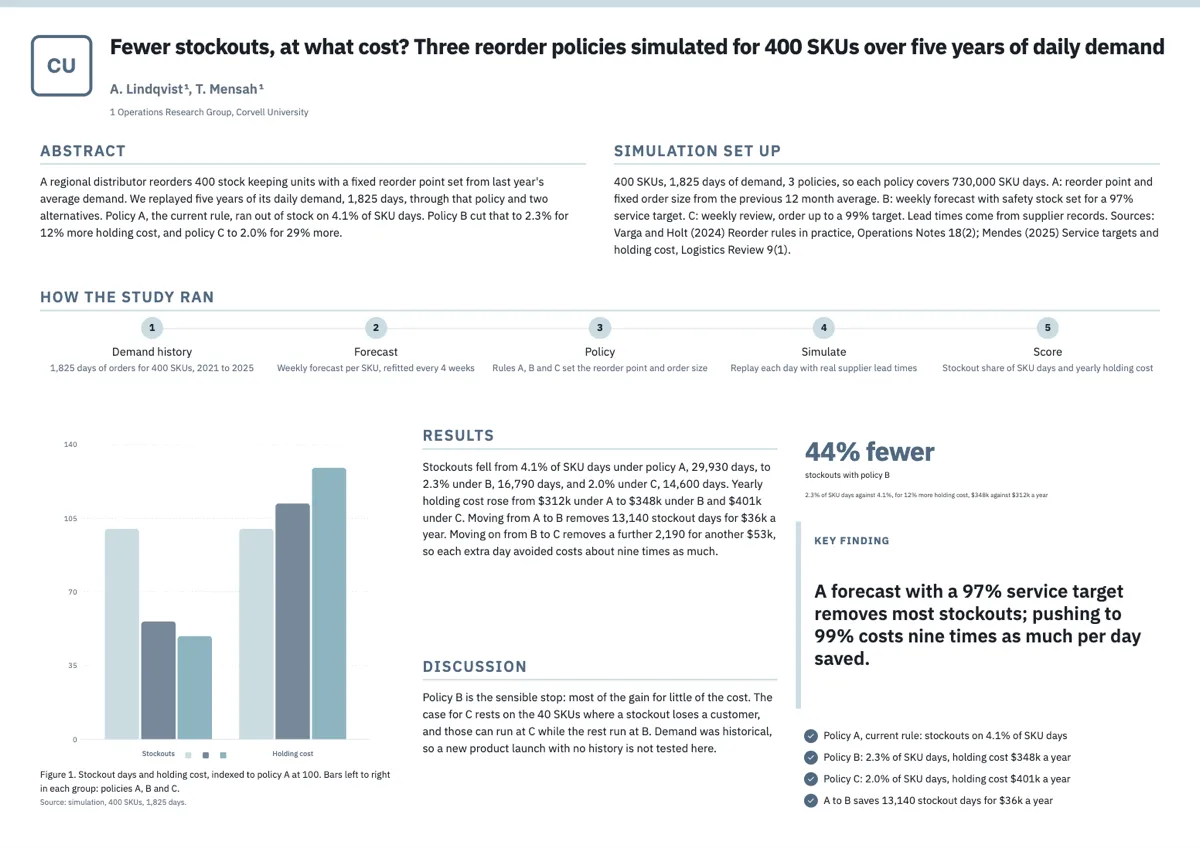
Supply chain research poster example
A supply chain research poster has to show a trade off, because every policy that cuts stockouts holds more stock. This A0 landscape board simulates three reorder policies for 400 SKUs over five years of daily demand: policy B cuts stockout days by 44% for 12% more holding cost, and policy C costs nine times as much per extra day saved.
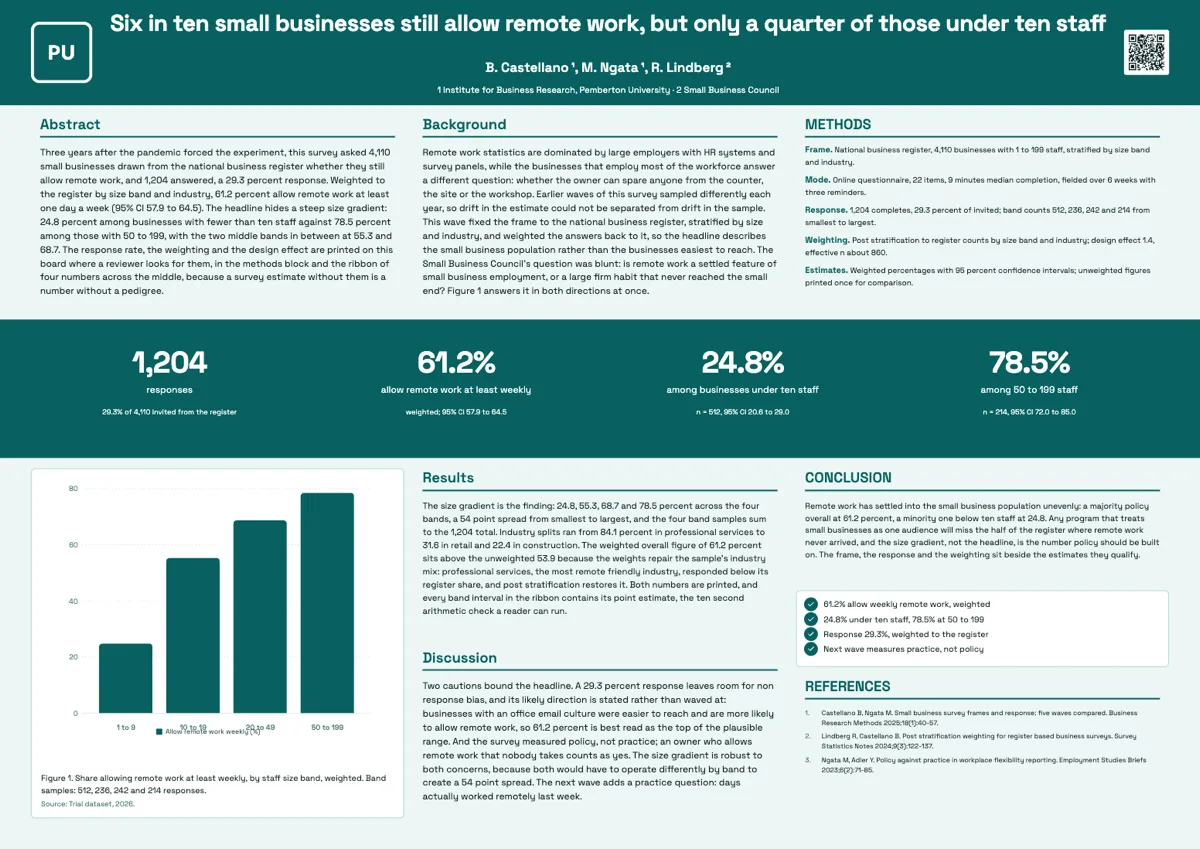
Survey research poster
A survey research poster should show its frame, its response rate and its weighting as clearly as its findings, because those three numbers decide how far a reviewer trusts the rest. This A0 landscape example reports a fictional register survey of 4,110 small businesses with 1,204 responses, charts remote work by staff size band, and shows a weighted headline that passes the simple check every survey board should run before it prints.
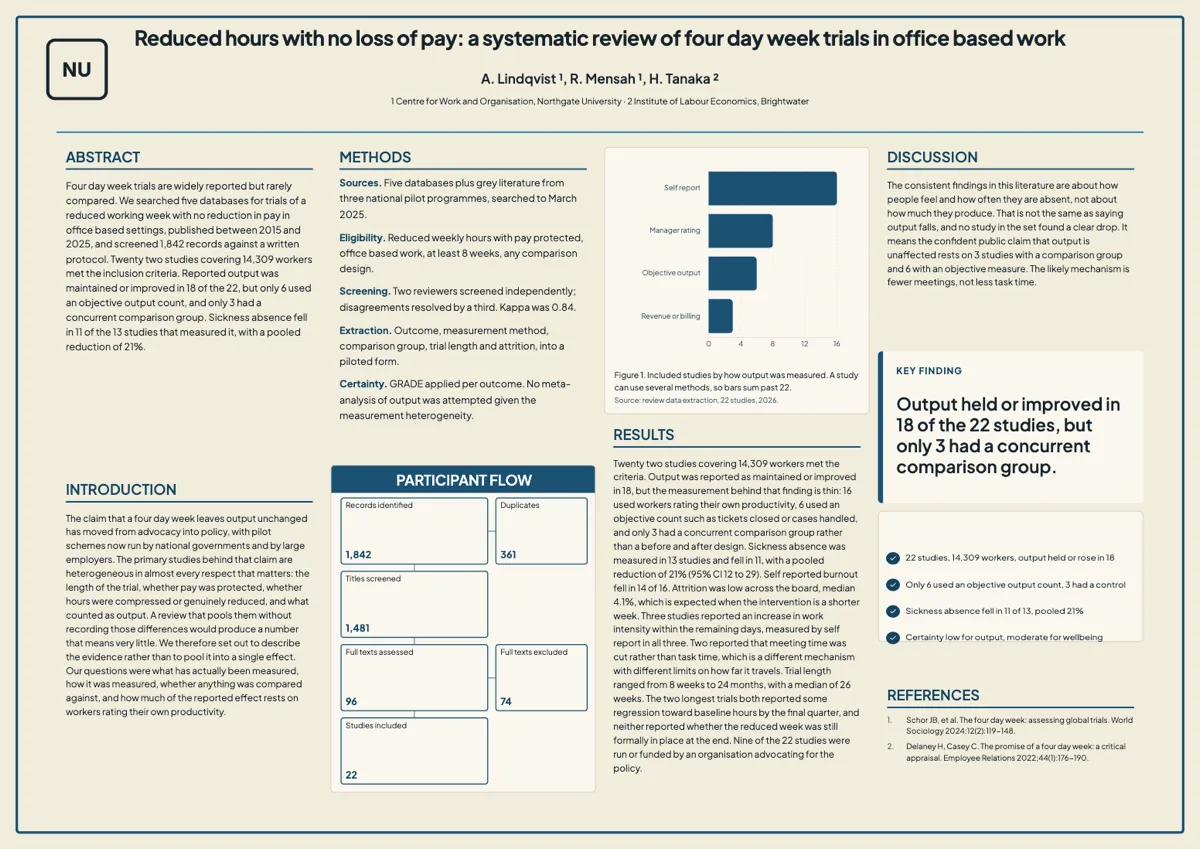
Systematic review poster
A systematic review poster has to show how many records were found, how many survived screening, and how much weight the included studies can bear. This A0 landscape example reviews fictional four day week trials in office work: 1,842 records identified, 22 studies included covering 14,309 workers, and output held in 18 of them but only 3 had a concurrent comparison group. It carries an abstract, an introduction, labelled methods, a six box screening flow, one bar chart, a key finding callout and four takeaways, and its flow leaves out one step worth adding before you build yours: the 1,385 records dropped at title screening, the gap between 1,481 screened and 96 full texts.
Thesis defence poster
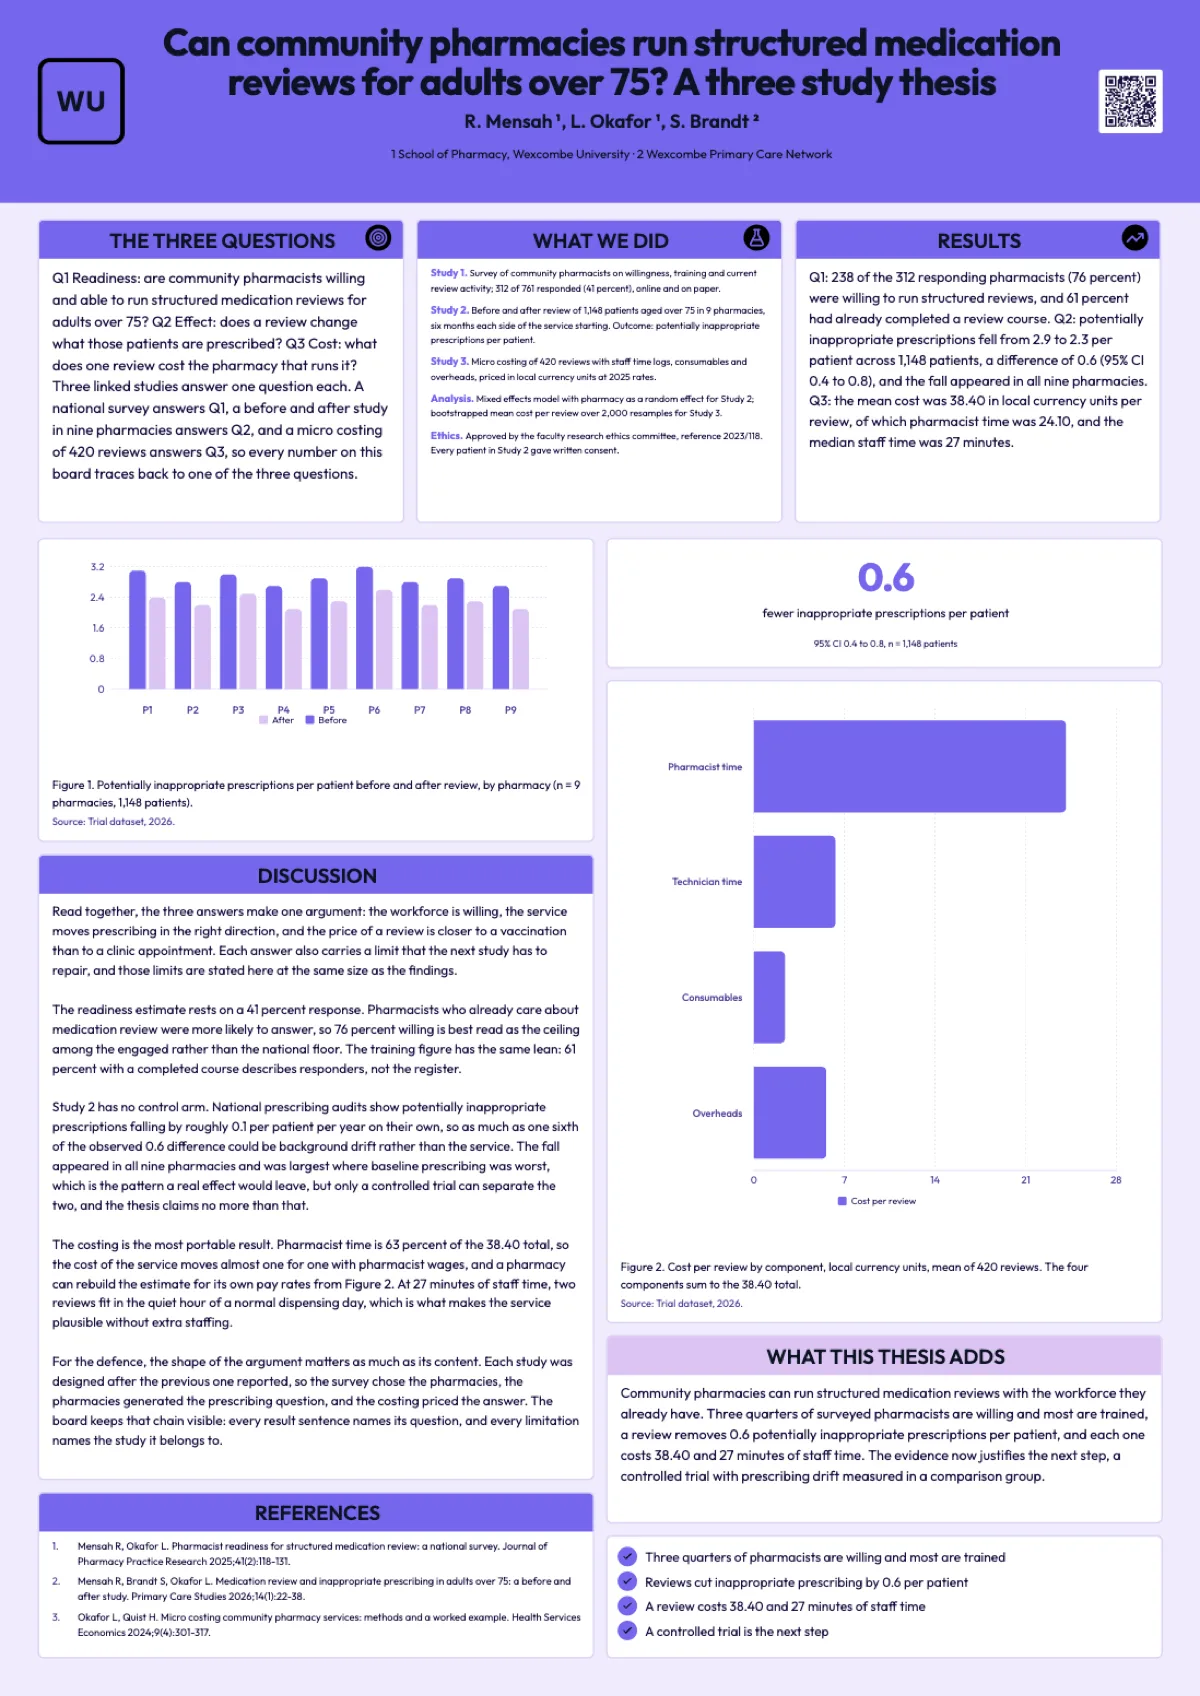
A thesis defence poster compresses years of doctoral work onto one board, and the reliable way to do it is to make the research questions the spine. This A0 portrait example shows a fictional pharmacy PhD cut down to three questions, each answered by one number: 76 percent of pharmacists willing, 0.6 fewer inappropriate prescriptions per patient, and 38.40 per review.
Undergraduate research poster
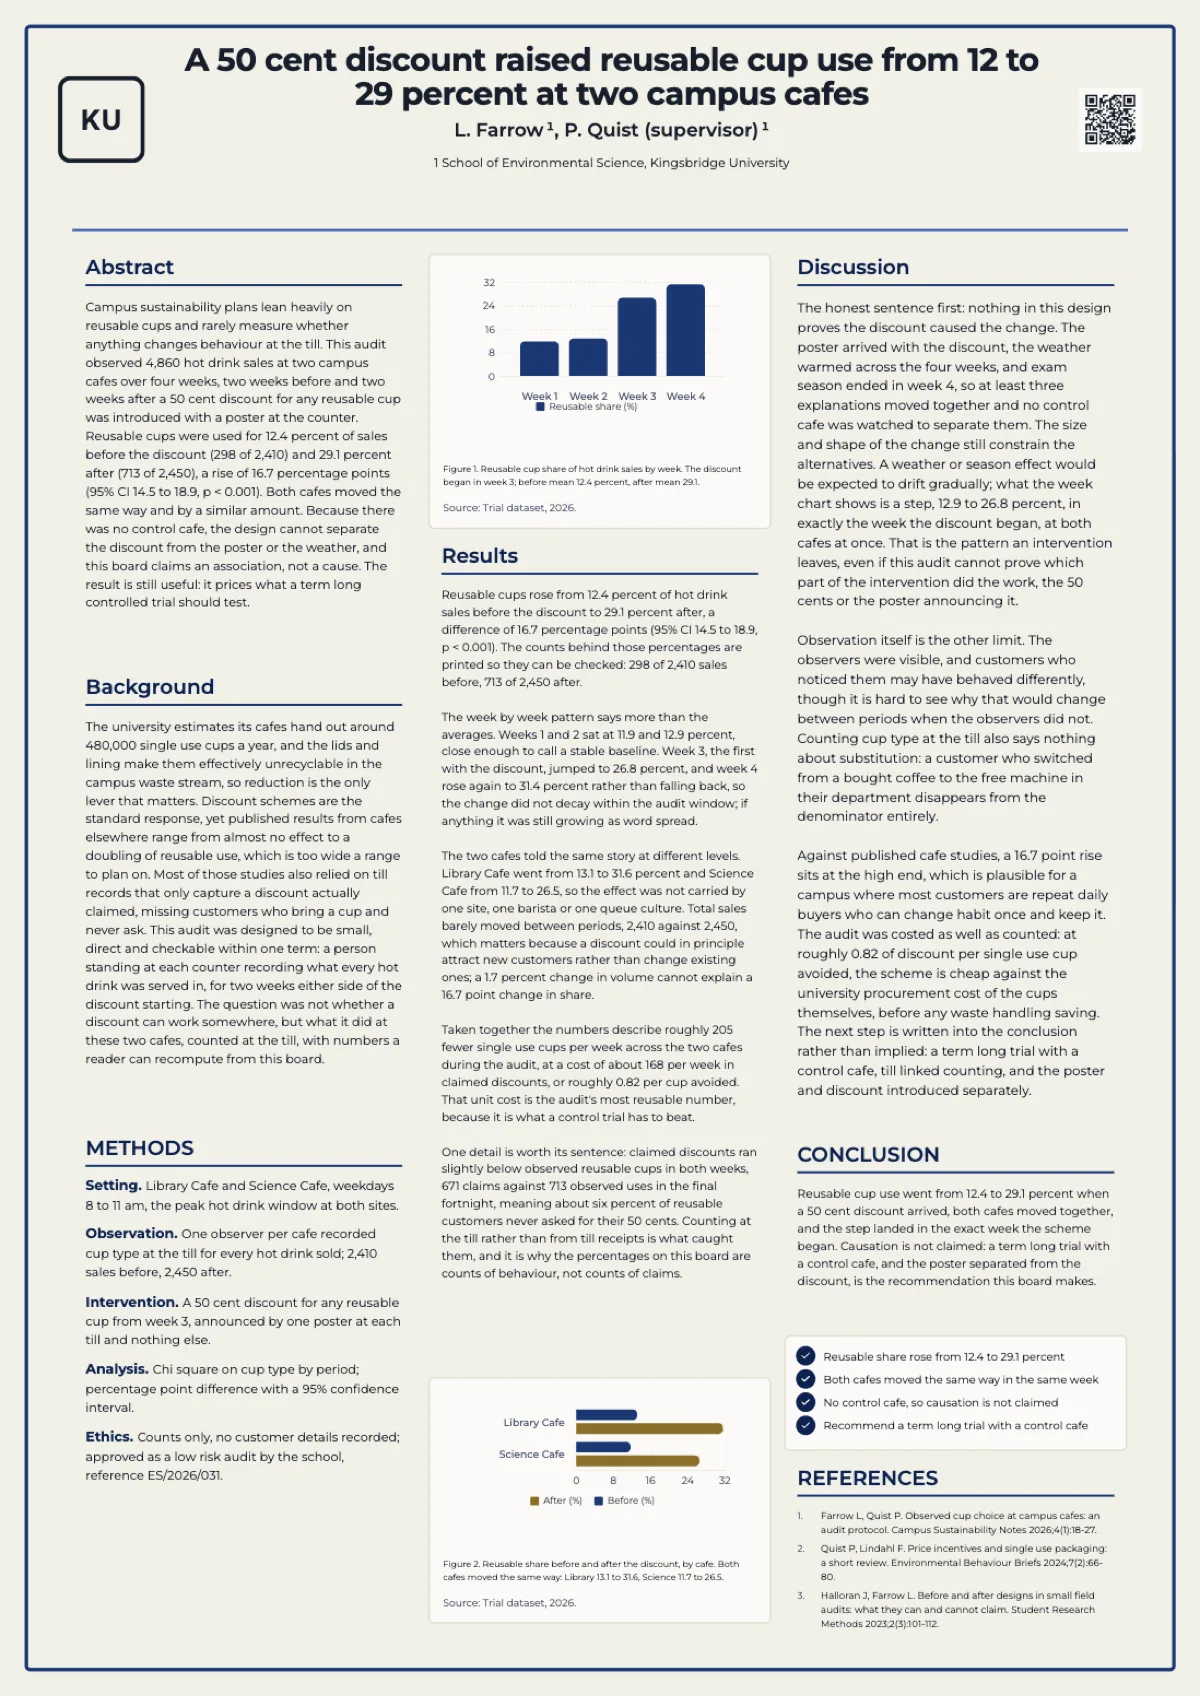
An undergraduate research poster does not need big numbers, it needs honest ones arranged in the standard scientific order. This A0 portrait example shows a four week audit of a 50 cent reusable cup discount at two campus cafes: 4,860 sales observed, use rising from 12.4 to 29.1 percent, and a conclusion that explicitly declines to claim causation.
Urban planning research poster example
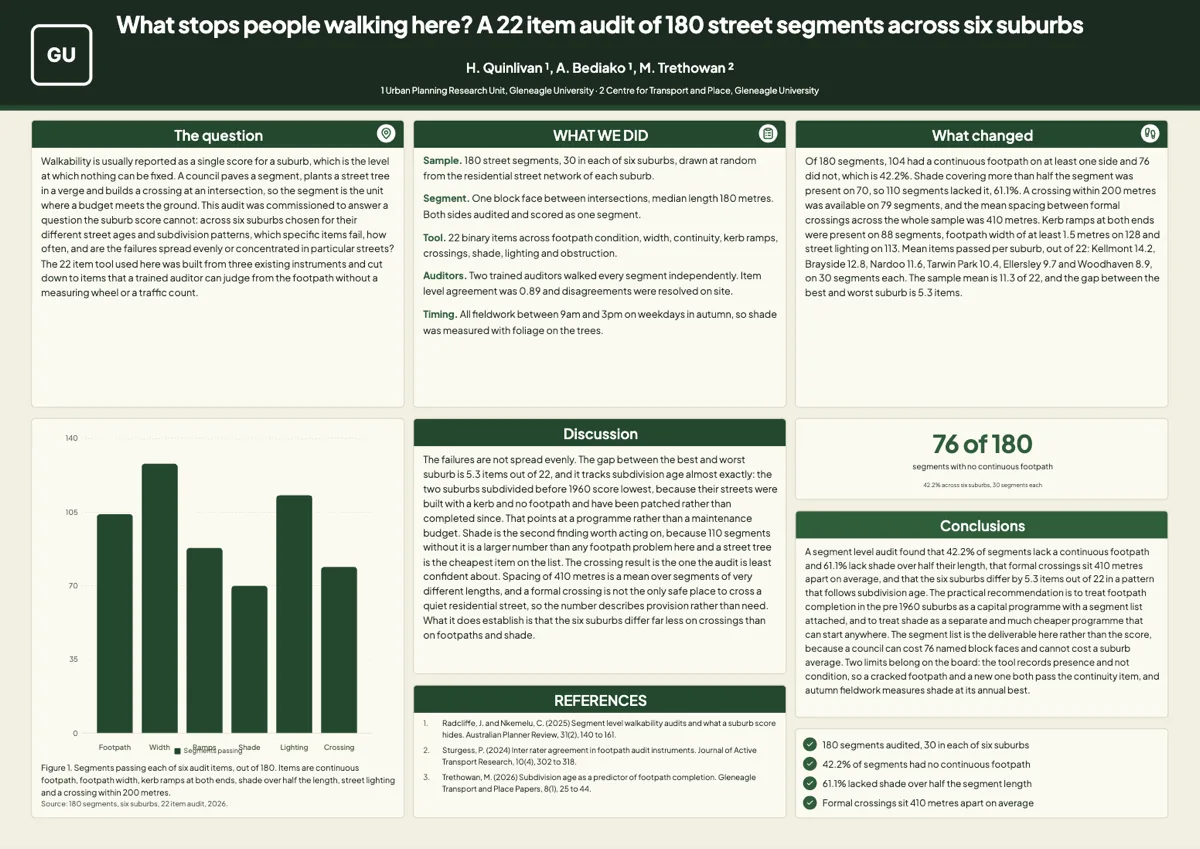
A walkability poster that reports a suburb score is reporting at the level where nothing can be fixed. This board works at the segment instead: 180 block faces across six Australian suburbs, scored on 22 items by two auditors, with 76 segments named as lacking a continuous footpath.
Veterinary research poster example
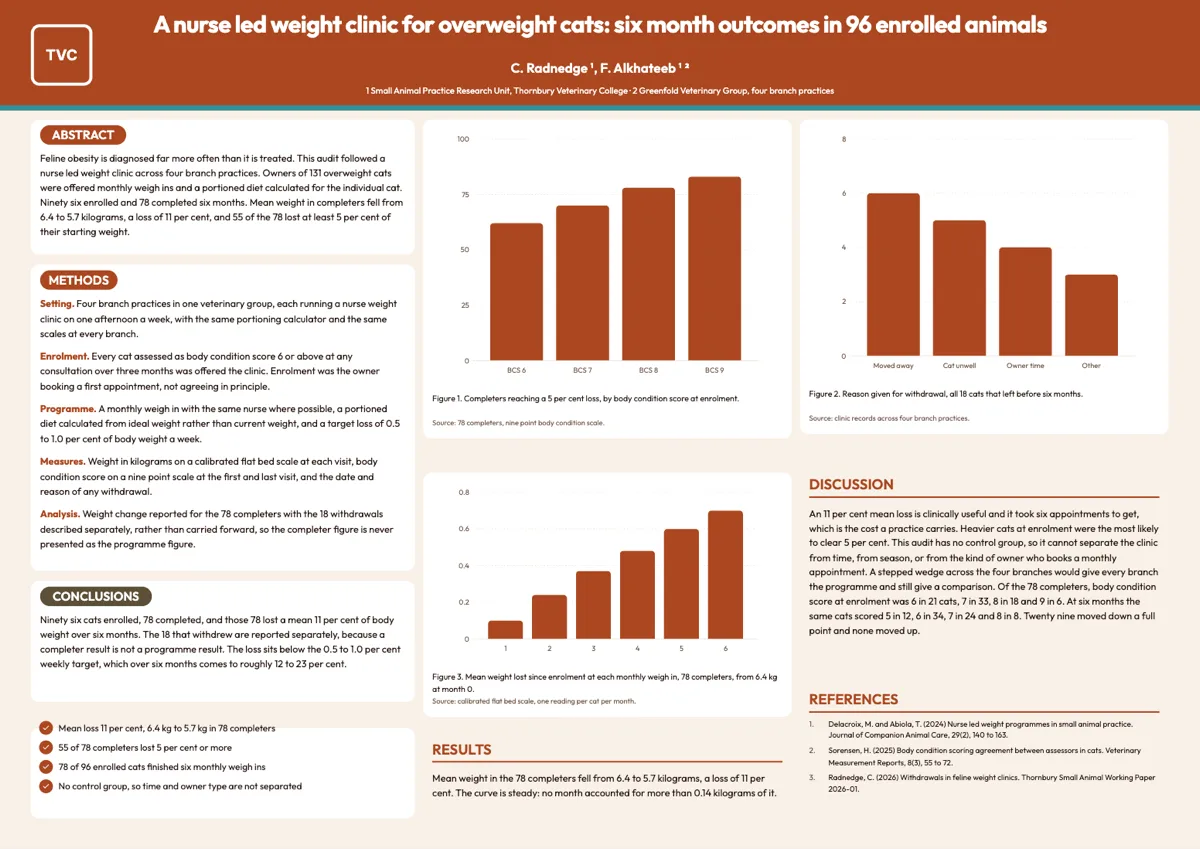
A veterinary research poster example should show how animals entered the study, how many finished, and whether the result describes the programme or only the animals that stayed. This A0 landscape board reports a fictional audit of a nurse led weight clinic across four branch practices: owners of 131 overweight cats offered a place, 96 enrolled, 78 completed six months, and a mean fall from 6.4 to 5.7 kilograms in those 78. Three chart figures carry the threshold result, the withdrawals and the monthly curve, and the text keeps completers apart from the programme throughout.
Build a poster from your own study
Paste what your study did and found, pick A0 portrait or landscape, and the generator writes every section and fills the charts and the participant flow from your numbers.
Make a poster