Videos
Animated chart in a video
A chart scene exists for the case where the shape of the data is the point, rather than one headline figure. Bars racing to different heights, a line climbing, a waterfall building to a total. All of it drawn from numbers you actually supply, because the director is not permitted to make any up.
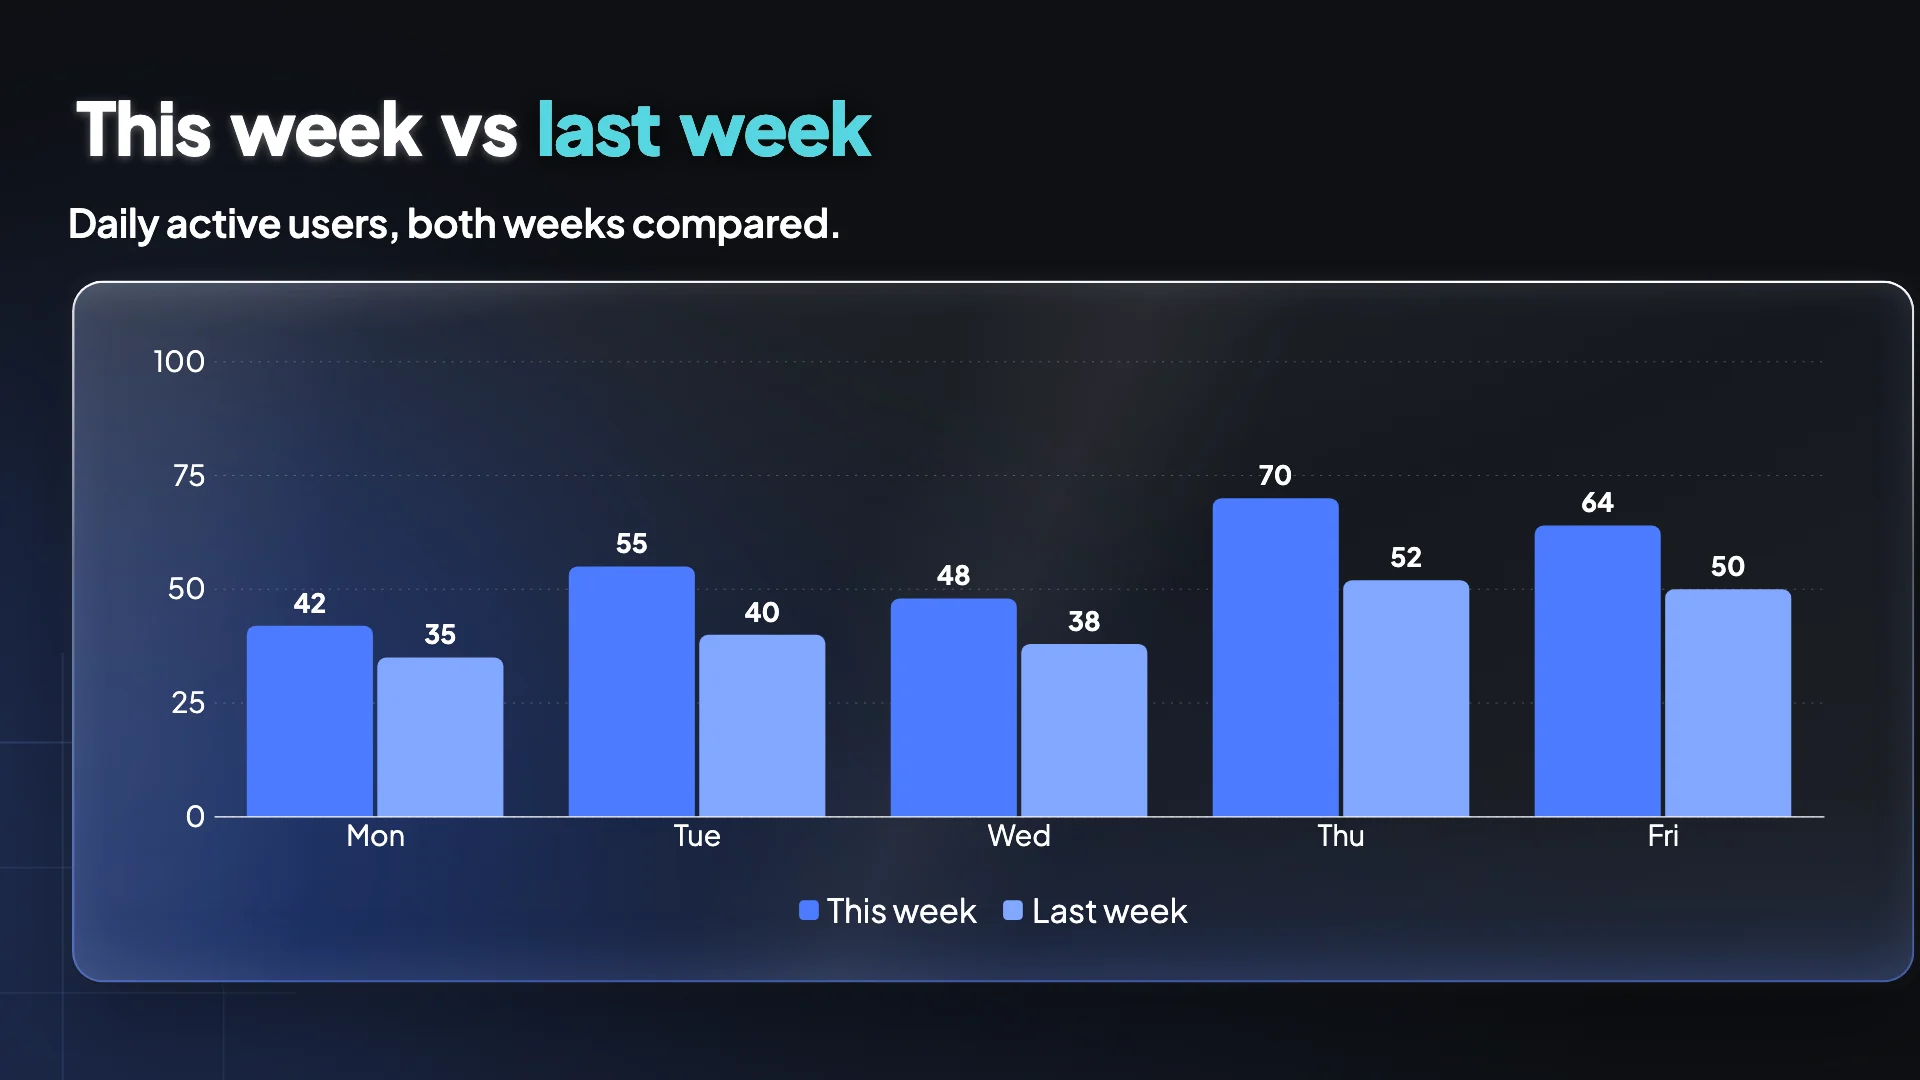
Ten chart types, one data shape
Vertical bars, horizontal bars, stacked columns, line, area, pie, donut, radar, waterfall and a waffle grid of counted squares. Underneath them all sits one normalised value made of categories and series, so the render type is swappable without touching the data. In the inspector that means switching a bar chart to a line is one click rather than re-entering everything.
How the numbers get in
From the brief, as comma separated values. The director is told chart components take comma separated numbers, so writing 88, 91, 94, 97 with their labels is what produces a chart. In the builder the chart section then exposes it properly: series with names and colour swatches, categories you can rename, a value per cell, an optional unit such as a currency symbol or a percent sign, and separate rows for key figures.
It animates because it is drawn, not rendered flat
Chart layouts sit in the high motion category, which matters because a promo is required to keep at least half its scenes there. Bars grow, a line draws itself, a waterfall stacks toward its total, a donut sweeps. That is not decoration: a number that arrives is read differently from a number that was already there when the scene cut in.
When a chart is the wrong choice
When there is one number. A single figure belongs in a stat scene, set huge and counting up, and several figures at once belong in a stat grid. A chart earns its place when the relationship between the values carries the meaning: a trend, a share of a total, a comparison across categories. With three unrelated numbers, a chart makes them look related when they are not.
How it works, in three steps
Step 1
Put the values in the brief
Numbers with their labels, in order. Without real figures no chart scene appears at all, because inventing them is forbidden.
Step 2
Switch the type after seeing it
The inspector offers the chart kinds the layout allows. The data survives the switch, so try the line before deciding on bars.
Step 3
Add the unit
Percent, a currency symbol, K. It is a separate field, so the axis stays clean and the numbers still read as what they are.
The full walkthrough with screenshots is in the guide Make a promo video with AI voiceover.
Limits worth knowing
- There is no data connection. No spreadsheet import, no live source, no formula. You type or paste the values.
- Chart scenes take text and numbers only. They will not accept an image.
- Each layout allows a specific set of chart kinds, so not every one of the ten is offered on every chart scene.
- Categories and series are capped per layout, so a chart with twenty categories has to be summarised before it goes in.
Questions people ask
Will it read a chart out of my document?
No. An attached document is summarised into a few sentences and key points, so a chart in a PDF does not survive as data. Type the values into the brief if you want them charted.
How many numbers can one chart hold?
Enough for a readable video, which is fewer than a report would use. Layouts cap their categories and series deliberately, because a dense chart on screen for four seconds communicates nothing.
Can I set the colours?
Yes, per series, from the theme's own tokens through a swatch row in the inspector. Using tokens rather than raw colours means the chart still recolours correctly if you change the palette later.
Is a pie chart a good idea?
Only for share of a total, and only with a few slices. A donut usually reads better at video sizes because the centre gives you somewhere to put the headline figure.
Make your own video
The button opens the generator with this use case already described. Change the wording to match yours, generate, then edit anything you like.
Create a video with OneCraftRelated pages
Animated number counter video
A counting number is a scene role, not an effect you bolt onto text. You type the figure the way it should read, and the renderer works out what is a number and what is decoration, then counts the number up and leaves the decoration alone.
Animated video backgrounds
Backgrounds here are applied one scene at a time, not once for the whole video, and every one of them is built from colour tokens rather than fixed hex values. So a background is not a picture you drop behind the content. It is a treatment that takes on whatever palette the video is using.
Animated map in a video
A map scene is for one specific claim: that you operate somewhere. It draws a world or region map with glowing markers on the cities you name, usually beside a count-up number. It is a coverage graphic, not a mapping tool, and the difference matters before you reach for it.
More finished work of this kind is on the video examples hub.
Written and checked by the OneCraft team. Last checked .