How to
Add charts and diagrams to a flyer
Put real data on a flyer. Ten chart types, SWOT and 2x2 matrices, funnels, Venn diagrams, org charts, Gantt timelines and world maps, all editable and styled by your theme.
Flyers3 min readUpdated
This guide shows you how to put charts, diagrams and matrices on a flyer, with your own numbers in them.
A flyer that says “we grew 40%” is a claim. A flyer with the chart is proof. The same data components that power presentations are in the flyer builder too.
Open the Add items panel
Click the + button on the right edge of the builder. The Add items panel opens: every tile inserts one ready-made item when you click it. Scroll past the text, badge and card sections and you reach the data ones.
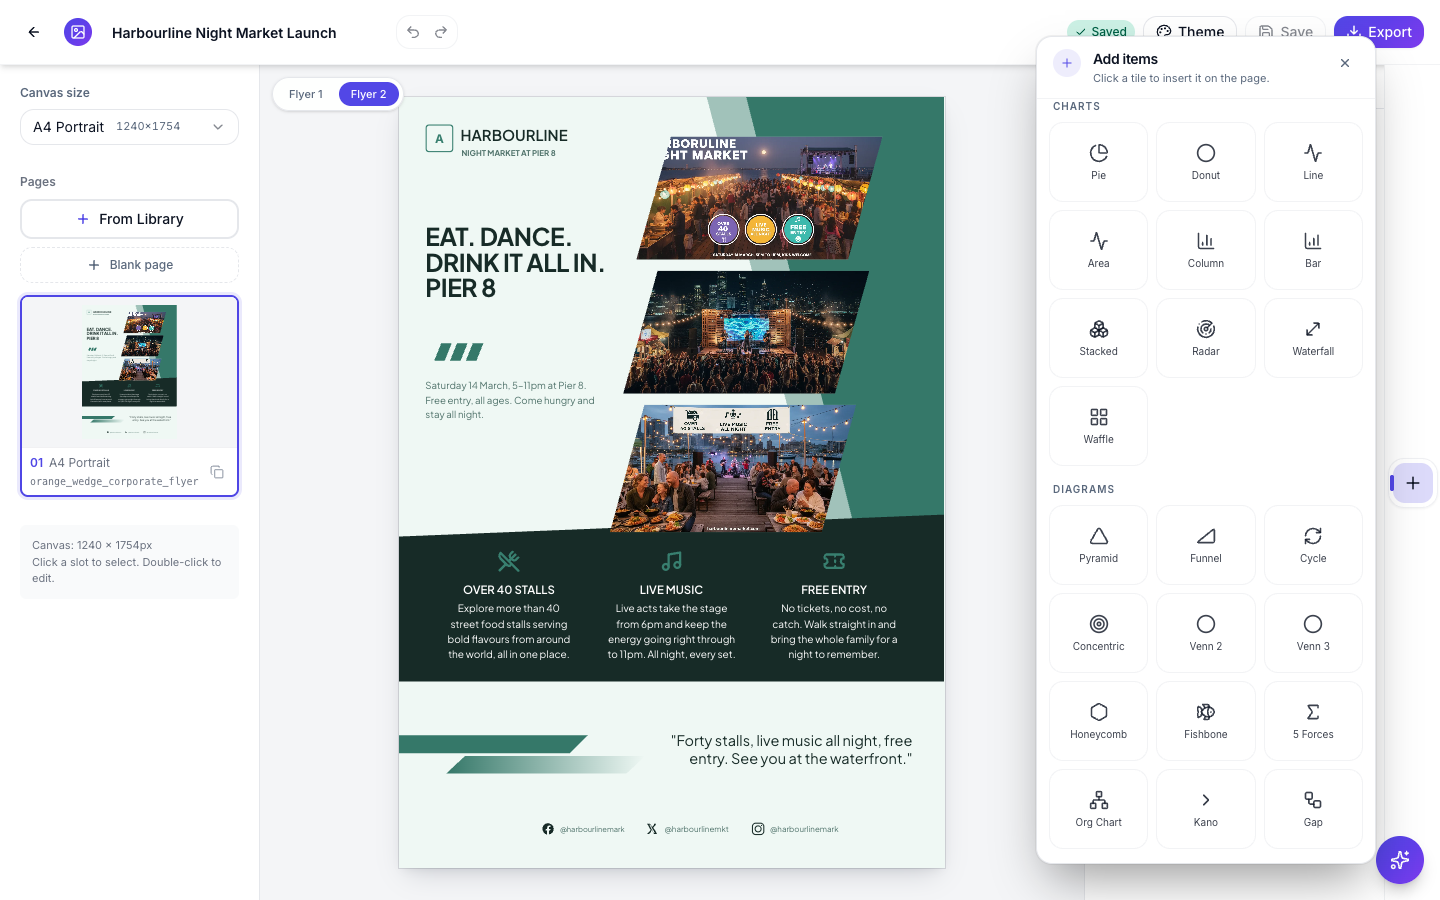 Charts and Diagrams in the Add items panel. One click inserts a tile.
What’s in there:
- Charts: Pie, Donut, Line, Area, Column, Bar, Stacked, Radar, Waterfall and Waffle.
- Diagrams: Pyramid, Funnel, Cycle, Concentric, Venn 2, Venn 3, Honeycomb, Fishbone, 5 Forces, Org Chart, Kano and Gap.
- Matrices: 2×2, 3×3 and SWOT.
- Tables: 2×2, 3×3 and 4×4.
- Timeline & map: Gantt and Map.
There are also stats, callouts, lists and cards further up, when a single big number tells the story better than a chart.
Edit the data, not the drawing
Click a chart tile and it lands on the page selected, with the inspector open beside it. Everything about it is a plain field: Chart type is a dropdown you can change after the fact, the Series has a name, and every Data row is a label and a value with + Add for more. Set a Unit like % or $ and the labels follow.
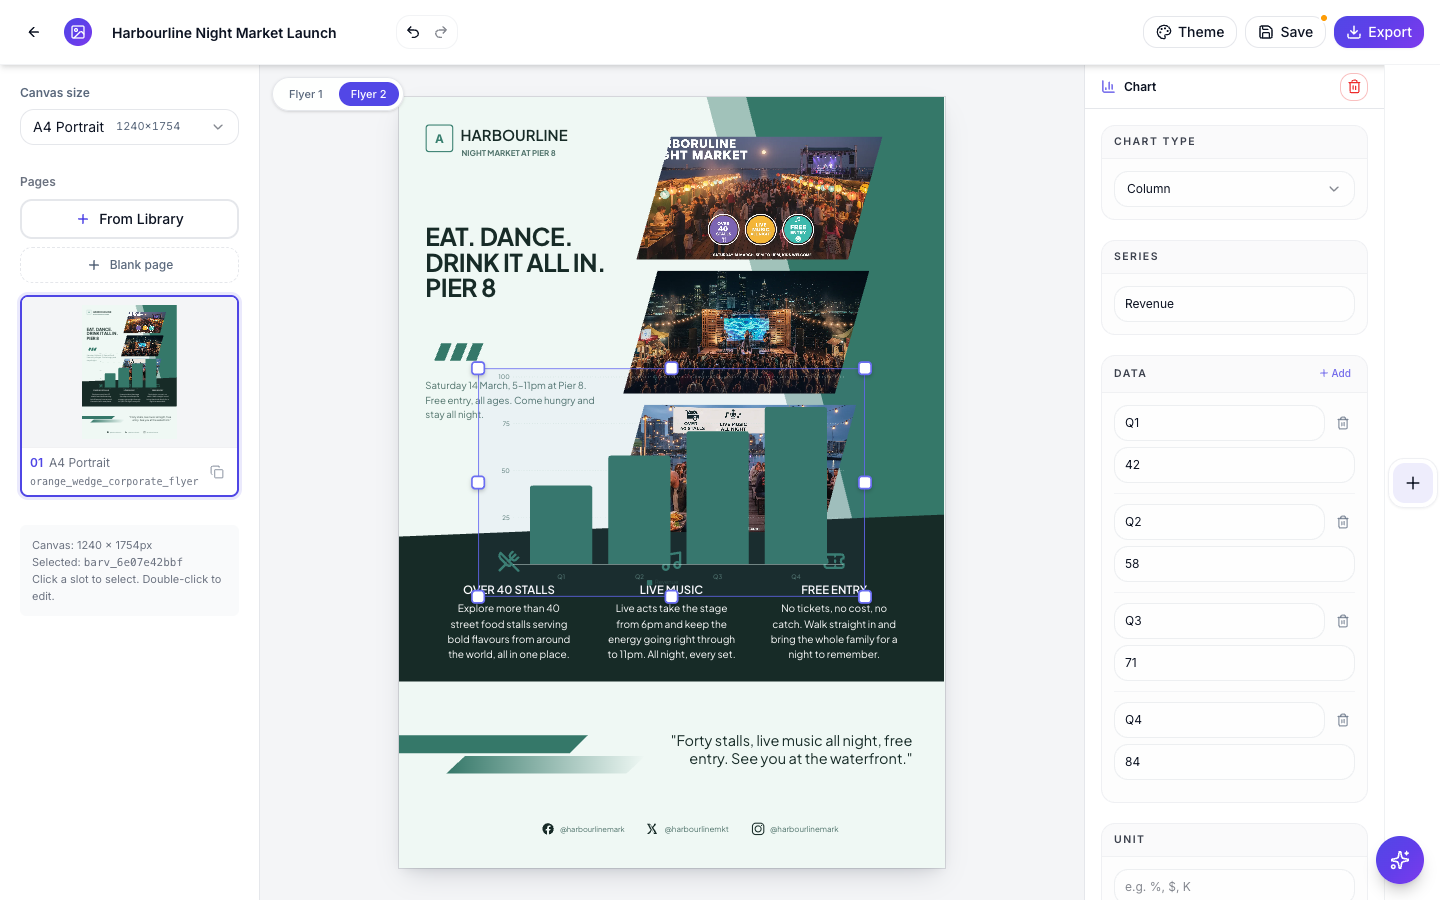 Type your numbers into the panel. The chart redraws as you go.
The colours are not yours to manage: every chart draws itself from the flyer’s theme palette, so it matches the rest of the design, and switching the theme restyles the chart with everything else.
Matrices come pre-structured
A SWOT lands as four filled quadrants with axis labels, and each cell is an editable field in the inspector: the heading and the bullet content of every quadrant, plus the X and Y axis labels. The 2×2 and 3×3 matrices work the same way for positioning maps and comparison grids.
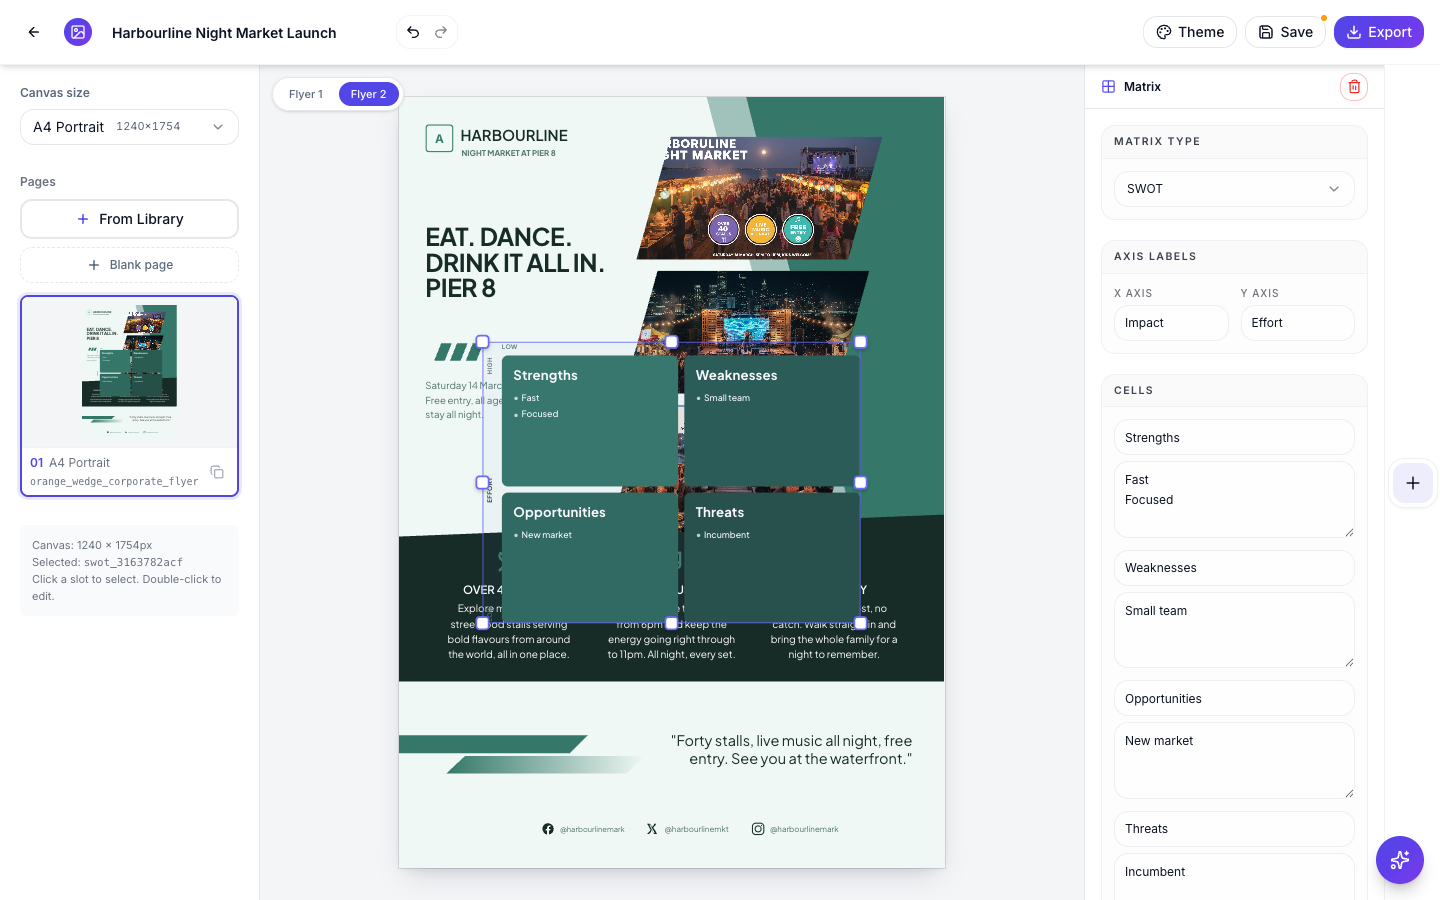 A SWOT is four editable cells and two axis labels, not a drawing you maintain.
Place it like anything else
An inserted item is a normal flyer element. Drag it where it belongs, resize it by the corner handles, and delete it with the bin icon in the inspector if you change your mind. Charts read best given a clear block of space, half the width or more, rather than squeezed beside a photo.
For the same components at slide size, see add charts, maps and diagrams to slides. To build the flyer itself first, start with create a flyer for Instagram and print.
Ready to try it yourself?
Start free. Describe what you need and let OneCraft do the first draft.
Get startedSee it in the product
More flyers tutorials
- Add or replace the images in a flyerDescribe the photo you want and OneCraft generates it at the right shape for the slot, or upload your own. Every image you make stays in the flyer to reuse.
- Change a flyer's colours and fonts with themesOne click recolours the whole flyer. 21 themes over 88 palettes, plus 27 fonts you can swap independently, and every element restyles together instead of one box at a time.
- Choose the template, theme and size for your flyerThe flyer generator has four choices above the Generate button: language, theme, format and an optional template. Here is what each one changes, and what you get back.