Presentations
Editable PowerPoint export
This export takes a slide apart. Anything PowerPoint has a native equivalent for is emitted as that object, and only the artwork it cannot express is left as a picture behind them. The result is a file somebody can actually keep working on.
Five kinds come out native
Text boxes, lists, images, tables and charts. A headline becomes a PowerPoint text box you can retype. A bulleted list becomes a real list with its bullet structure intact, including bold and italic runs from the original. A table becomes a PowerPoint table with its rows and columns. An image becomes a picture you can swap. A chart becomes a chart object with its data behind it.
Nine of the ten chart kinds map cleanly
Columns, bars and stacked columns become PowerPoint bar charts with the right direction and grouping. Line, area, pie, doughnut and radar map straight across. Waterfall is built the way it is drawn here, as stacked columns with an invisible base floating each delta. Waffle is the exception: PowerPoint has no honest equivalent for a ten by ten dot matrix, so it stays in the picture layer rather than being faked.
Artwork stays artwork, but the labels do not
Diagrams, matrices, Gantt charts, flowcharts, maps and buttons are drawn as vector artwork that PowerPoint has no object for, so they remain part of the picture underneath. Their text does not: every label on them is emitted as a separate PowerPoint text box positioned over the artwork. So you can correct a spelling on a funnel stage or rename a Gantt task without redrawing anything.
A base plate under everything
Each slide starts as a full bleed picture with all the editable content hidden, capturing only the background, the panels and the artwork. The native objects are then placed on top in the layout's own stacking order. That is why the file looks right rather than approximately right: the parts PowerPoint cannot express are still pixel accurate, and the parts it can are real.
Why it is built inside a browser
The export runs in a headless browser on the server rather than in plain code, because emitting a text box needs the measured position and the font size the text actually settled at after shrink to fit, and only a live layout knows that. It is slower than the picture only export for the same reason, and it is worth it whenever the file has a life after you send it.
How it works, in three steps
Step 1
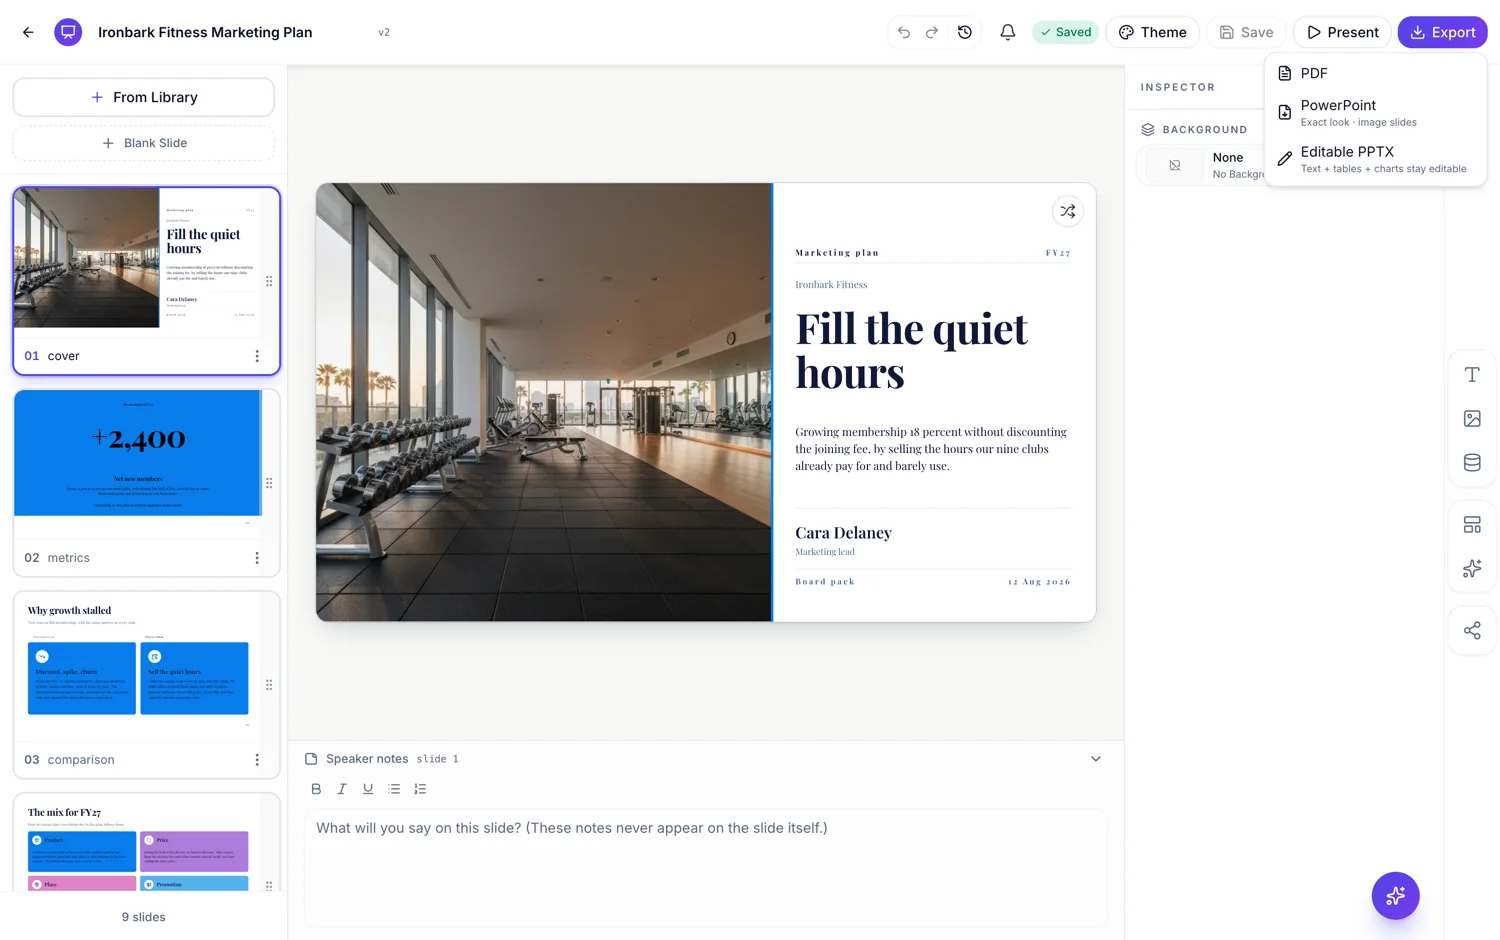
Choose Editable PPTX
Third entry in the download menu, described as text plus tables plus charts stay editable.
Step 2
Give it longer
It measures a live layout and emits objects per slide, so it takes noticeably longer than the picture export.
Step 3
Open it and click a headline
If the cursor lands in the text, the export did its job. Check a chart and a table next.
The full walkthrough with screenshots is in the guide Export a presentation to PowerPoint or PDF.
Limits worth knowing
- Needs a Starter plan or higher, the same gate as the picture only PowerPoint export.
- Waffle charts have no native PowerPoint equivalent and stay in the picture layer.
- Diagram, matrix, Gantt, flowchart and map artwork stays a picture. Only their labels become text.
- It takes longer to produce than the picture export, because it measures a live layout slide by slide.
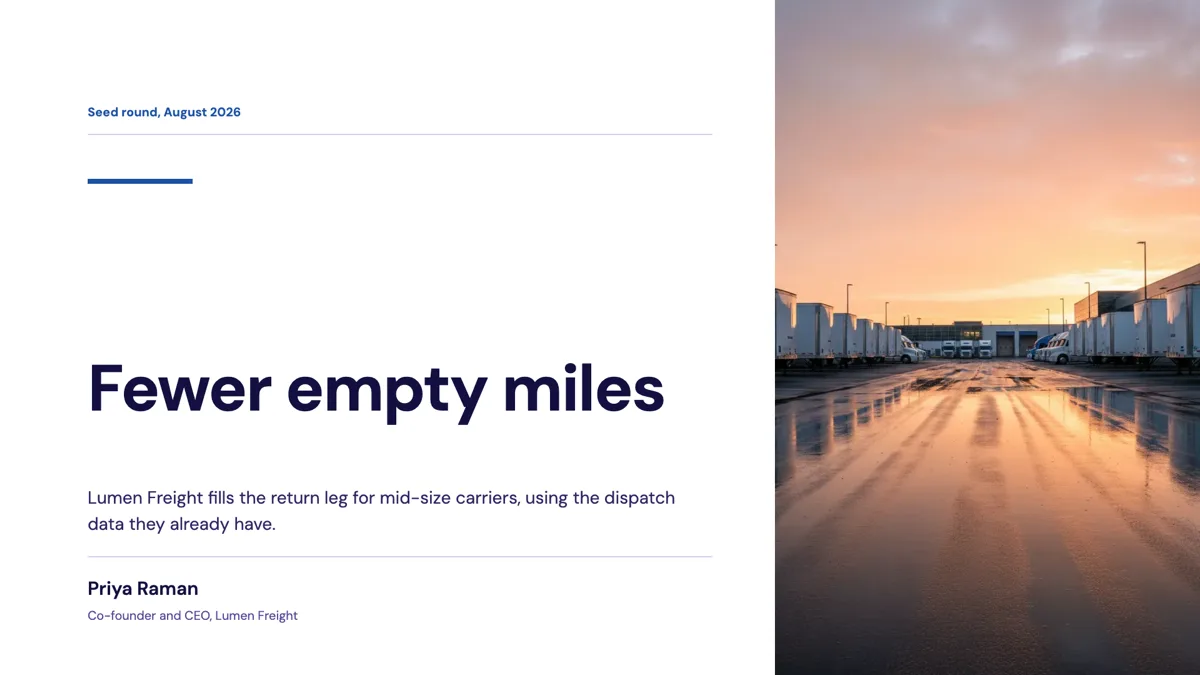
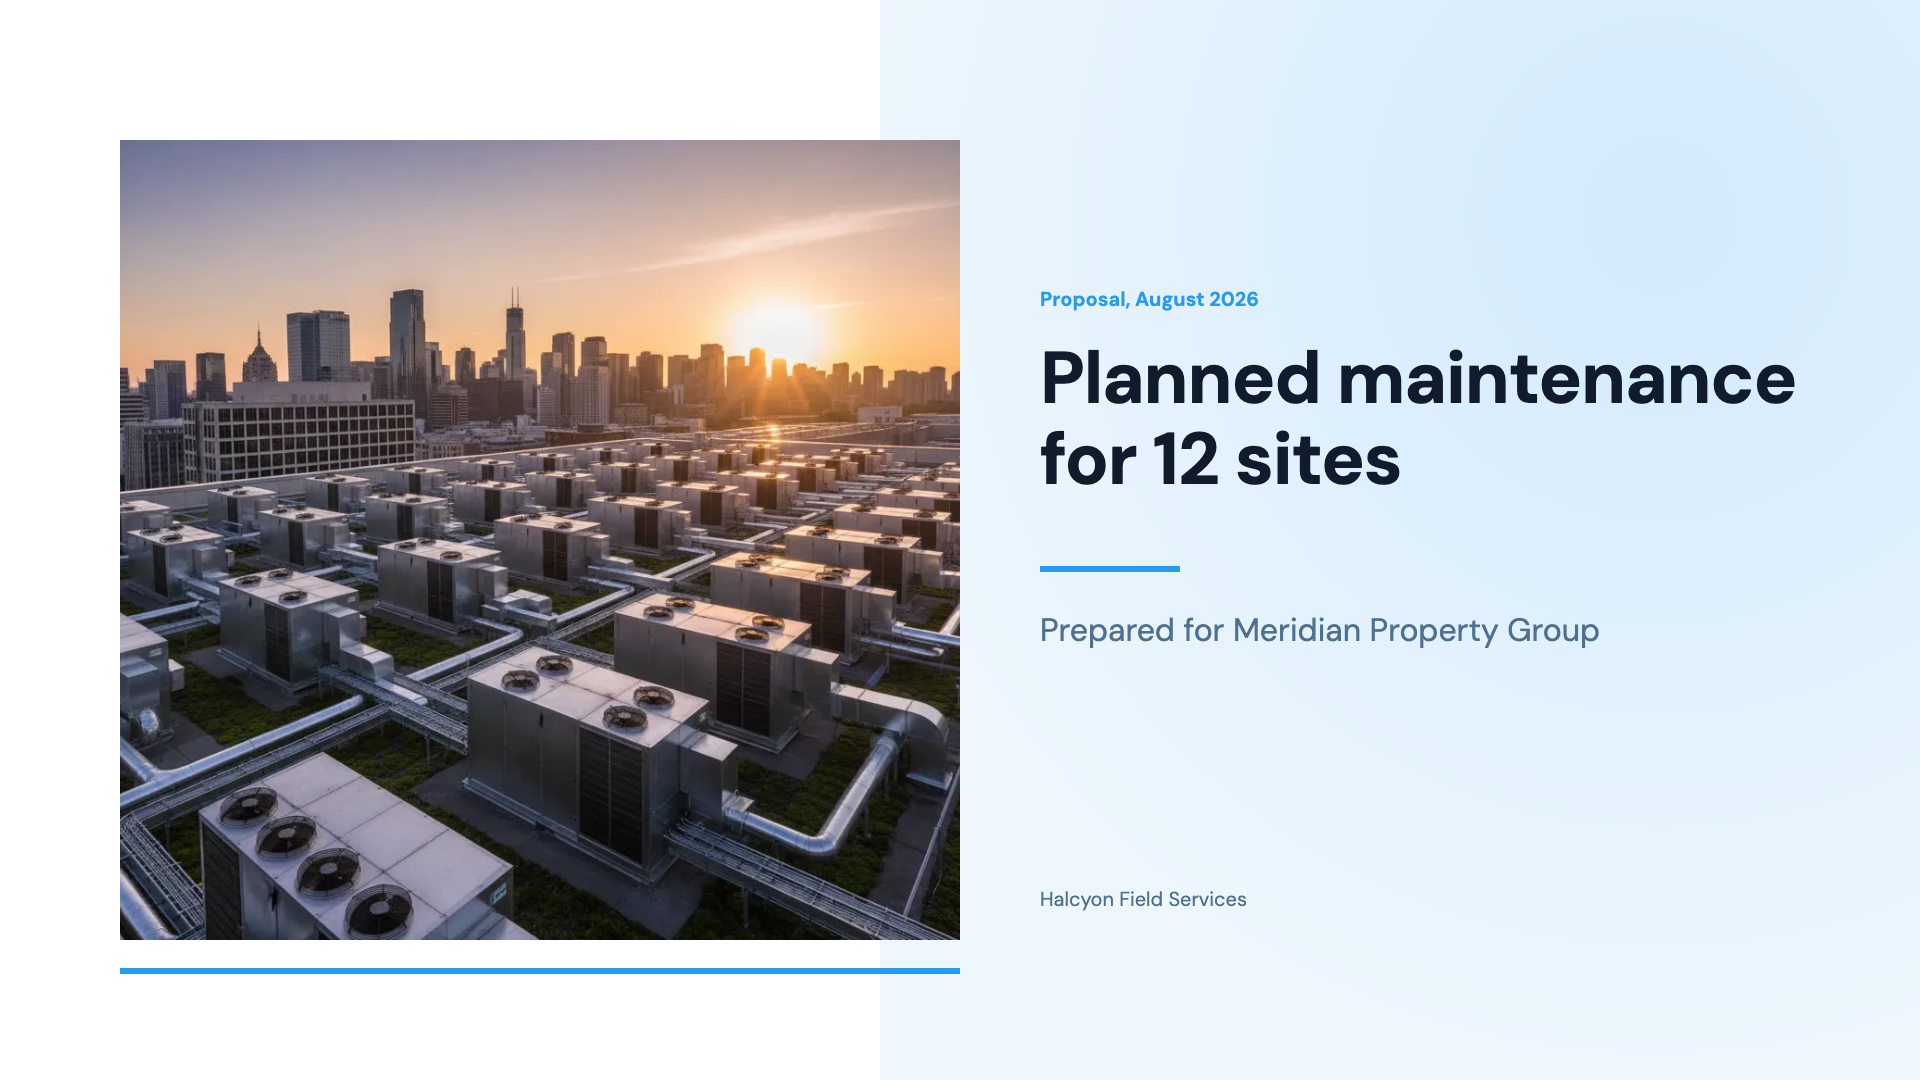
See it on a finished piece

Questions people ask
Can I edit the chart data in PowerPoint?
Yes, for nine of the ten chart kinds. They come across as real PowerPoint chart objects with their categories and series, so PowerPoint's own data editor opens on them.
What happens to a funnel or an org chart?
The drawing stays as part of the picture underneath, but every label on it becomes a separate text box. You can retype the words without redrawing the shape.
Which export should I send a client?
The picture only one, unless they need to change something. It is faster to produce and impossible to break. Send this one to someone who will keep working on the deck.
Does the styling survive?
Yes. Text is emitted with the size it settled at after fitting, its weight, its colour and its bold and italic runs, so a retyped headline keeps looking like the original.
Make your own presentation
The button opens the generator with this use case already described. Change the wording to match yours, generate, then edit anything you like.
Create a presentation with OneCraftRelated pages
Export to PowerPoint
Two PowerPoint exports exist and they solve different problems. This is the one whose entire job is looking right: each slide is placed into the file as a picture, so what opens in PowerPoint is exactly what you designed, on any machine, with no fonts to install.
Presentation version history
Versions are created when you save, not on a timer, so the history is a list of decisions rather than a stream of keystrokes. Each one carries a summary of what changed, which is what makes a long list readable instead of a wall of timestamps.
Gantt chart slides
A Gantt on a slide is a communication object, not a plan. It exists to show an audience which things overlap and roughly when, which means the useful version has eight bars and readable labels, not two hundred rows exported from a scheduling tool.
More finished work of this kind is on the presentation examples hub.
Written and checked by the OneCraft team. Last checked .