Flyers
Flyer with a chart
Charts belong on a flyer far less often than people put them there, but when the message is a number moving, one chart does the work of a paragraph. Here it is a block you insert, type figures into, and then flip between ten shapes until one of them actually reads.
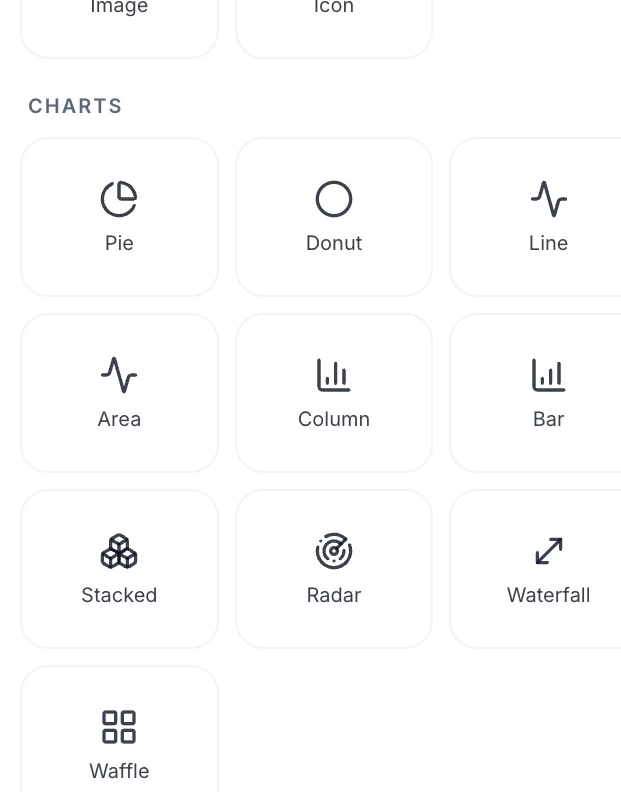
Ten kinds, one set of numbers
Column, Bar, Stacked, Line, Area, Pie, Donut, Radar, Waterfall and Waffle. Every chart you insert carries all ten as switchable options, because the data is stored as categories and series regardless of how it is drawn. So typing your numbers once and then cycling the kind until the shape suits the flyer costs nothing, which is the fastest way to find out that a donut is not it.
You type the data, all of it
The inspector gives you three sections: Series with a name each, Data with a category label and a value per series, and Unit for the symbol shown against the figures. Add a category or a series with the buttons beside each heading. Nothing is imported, nothing is calculated and nothing is summed, so a total has to be a value you type.
Colours come from the theme, full stop
Series cycle through four theme tokens: brand, brand secondary, brand accent and muted ink. Axes, grid lines and labels are resolved from the theme too, and are contrast checked against whatever the chart is sitting on. There is no colour control anywhere in the chart inspector, which is a limitation and also the reason a chart never clashes with the flyer around it.
Almost every chart is one you added
Only 4 of the 259 designs ship a chart slot, 26 of the 1,813 template files, so a chart on a flyer is nearly always a block you inserted rather than one the design shipped. It lands in the middle of the page at a generous size and you drag and resize it from there. Building the flyer around it, rather than dropping it into a finished layout, gives a better result.
The chart kind is remembered per canvas size
Switching kind is stored in the style override layer, and that layer is keyed by canvas size. So a column chart on the A4 page can be a bar chart on the Instagram version, which is genuinely useful because horizontal bars fit a wide social canvas and vertical columns fit a tall print one. It also means changing the kind at one size does not change it at another.
How it works, in three steps
Step 1
Insert a chart from the element panel
Add items has a Charts section with ten tiles. Any of them will do, since the kind is switchable afterwards.
Step 2
Type the categories and values
Series names, category labels, one value per cell, and a unit symbol if the figures need one.
Step 3
Cycle the kind until it reads
Use the Chart type selector. Four categories usually want a column; two want a big number instead of a chart.
The full walkthrough with screenshots is in the guide Add charts and diagrams to a flyer.
Limits worth knowing
- Charts hold values you type. There is no import, no calculation and no live data source.
- There is no colour control. Series cycle through four theme tokens and axes follow the theme.
- The chart kind is stored per canvas size, so it does not carry between sizes.
- Only four designs in the whole template library ship a chart slot, so charts are usually inserted by hand.
- There is no legend toggle, axis range or gridline setting in the flyer chart inspector.
See it on a finished piece

Questions people ask
Can it read my spreadsheet?
No. You type the categories and the values into the inspector. It is a presentation block, not a data connection, and nothing recalculates when the underlying figures change.
Can I set the colour of one series?
No. Series colours come from four theme tokens in order. Changing the theme changes them all together, which is the only lever available.
Which chart suits a flyer?
Column and bar, almost always. A flyer is read quickly from a distance, and a chart with more than about five categories or two series stops being readable long before it stops fitting.
Do the same charts exist on slides?
The element catalogue that feeds the flyer panel is used only by the flyer builder, so these ten tiles are the flyer's set. Presentations have their own chart tooling.
Make your own flyer
The button opens the generator with this use case already described. Change the wording to match yours, generate, then edit anything you like.
Create a flyer with OneCraftRelated pages
Charts in a document
A chart earns its place when the shape of the data is the point. Six types are available, they take the document theme colours, and the honest advice is that most documents need fewer charts than they contain.
Add icons to a flyer
Icons on a flyer are theme coloured vector marks, not pictures. The picker opens on 135 featured ones, and typing at least two letters searches the whole Lucide library behind them.
Flyer with a map
Most people searching for a map on a flyer want the corner their shop is on. That is not what this block does. It is a world map you colour country by country, which is the right tool for showing reach and the wrong tool for showing an address, and the difference is worth five minutes before you build.
More finished work of this kind is on the flyer examples hub.
Written and checked by the OneCraft team. Last checked .