Conversational form
Pricing survey template with the four Van Westendorp questions
A pricing survey finds the range of prices buyers will accept by asking where a price becomes too cheap to trust, a bargain, expensive and too expensive. This template asks those four Van Westendorp questions for a paid app plan, after current spend, and follows them with the features people would use and who they are.
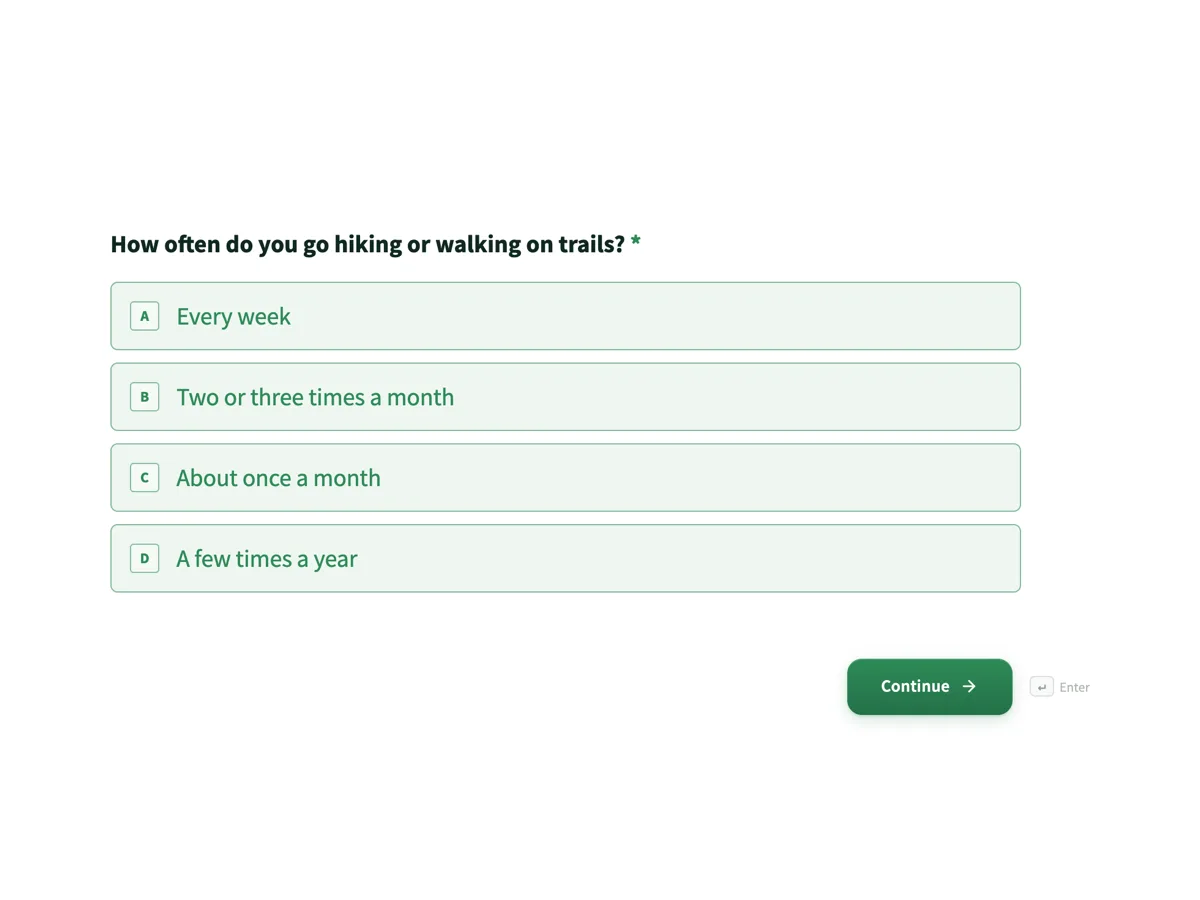
The form itself
The first screen of the form. A conversational form shows one question per screen, so the remaining screens are listed in the field table below. Nothing here can be filled in or submitted, so read it as a reference and build your own from the button above.
Every field, and what it collects
The complete field list, in the order respondents meet it.
- How often do you go hiking or walking on trails?Single choiceRequired
- Options: Every week · Two or three times a month · About once a month · A few times a year
- How much do you spend on outdoor or map apps in a year now?Single choiceRequired
- Options: Nothing, I use free apps · Under $20 · $20 to $49 · $50 to $99 · $100 or more
- At what yearly price would Ghyllpath Pro be so expensive that you would not consider buying it?NumberRequired
- Type a yearly price in dollars, whole numbers are fine.
- At what yearly price would it start to feel expensive, so you would have to think about it, but still might buy?NumberRequired
- Type a yearly price in dollars, whole numbers are fine.
- At what yearly price would it be a bargain, a great buy for the money?NumberRequired
- Type a yearly price in dollars, whole numbers are fine.
- At what yearly price would it be so cheap that you would doubt the quality?NumberRequired
- Type a yearly price in dollars, whole numbers are fine.
- Which Pro features would you actually use?Multiple choiceRequired
- Options: Offline topographic maps · Live location sharing with a contact · Route planning with elevation profiles · Track recording and statistics · Trail condition reports from other hikers · None of these
- Which best describes you?Single choiceRequired
- Options: Day walker on marked trails · Weekend hiker, sometimes off trail · Multi day trekker · Trail runner · Guide or club leader
What each screen of this survey collects
Hiking frequency is a radio of four bands. Current spend on outdoor apps is a radio of five, from nothing to $100 or more a year. Then come four number fields in yearly dollars: the price that is too expensive to consider, the price that starts to feel expensive, the bargain price and the price so cheap the quality is doubtful. Each has a help line and an example in the placeholder. Features is a checkbox of five Pro features plus none of these. The segment question offers five kinds of hiker, from day walker to guide. All eight screens are required.
How the four answers become a price range
Plot four cumulative curves across every price: the share calling each price too cheap, a bargain, expensive and too expensive, with the bargain and expensive curves reversed into not a bargain and not expensive. Where too cheap crosses not a bargain is the point of marginal cheapness, the floor. Where too expensive crosses not expensive is the point of marginal expensiveness, the ceiling. Between them lies the range of acceptable prices. Two more crossings sit inside it: the optimal price point, where too cheap meets too expensive, and the indifference price point, where expensive meets bargain. The current spend question then shows whether the range sits above what people already pay.
How to adapt this survey
A monthly subscription changes every price question to a monthly figure and the help line to match. A physical product describes the item fully on the welcome screen, since buyers cannot try it. A service business adds a screen on how often the service would be used, so a yearly figure can be read against frequency.
What makes this form work
Four separate number fields
Each Van Westendorp threshold is its own screen with an example price, so no respondent confuses the bargain price with the expensive one.
Current spend gives context
The spend question before the prices shows whether the acceptable range sits above or below what people pay for map apps today.
Prices can be split by hiker
The five hiker types and four frequency bands let the price range for multi day trekkers be read apart from day walkers.
Questions people ask
What is the Van Westendorp price sensitivity meter?
A pricing method published by the Dutch economist Peter van Westendorp in 1976. It asks four questions about when a product seems too cheap, cheap, expensive and too expensive, then plots the cumulative answers to find an acceptable price range. It needs no list of prices from the researcher, which makes it useful before a price exists.
Why ask the too expensive question first?
Starting at the top anchors people on what they would refuse to pay, which tends to give more considered answers lower down. Some researchers start with too cheap instead. What matters more is keeping the same order for everyone and wording each question identically, so this template fixes the order from too expensive down.
What if someone types prices in the wrong order?
It happens, for example a bargain price higher than the expensive price. A conversational number field does not enforce limits or compare answers, so clean the data afterwards: drop any respondent whose four prices are not in a sensible order, and drop extreme outliers. Expect to remove a small share of responses this way.
Does Van Westendorp tell you the price that earns the most revenue?
No. It shows the range people find acceptable, not how many would actually buy at each price. Some teams add a purchase likelihood question at two or three prices inside the range, known as the Newton, Miller and Smith extension, to estimate demand. This template keeps to the four core questions.
Who should receive a pricing survey?
People who could realistically buy, which for an app plan means active free users and people in the target market. Sending it only to the most loyal users pushes the range up. The frequency and segment screens let answers be split, so the range for weekly hikers can be compared with that for occasional walkers.
How many responses make the curves reliable?
A common rule of thumb is at least 100 to 200 complete, cleaned responses per segment you want to price separately. With fewer, the crossing points move noticeably when a handful of answers change. If the segments differ a lot, it may be worth offering different plans rather than one compromise price.
Build your own in about a minute
The button below opens the generator with this use case already described. Change the wording to match your own, generate, then edit anything you like.
Make one like thisOther form examples
Concept testing survey template: two concepts, one preference
A concept testing survey shows people a product idea before it is built and measures how appealing and believable it is, so a team can choose between ideas on evidence. This template rates two written concepts one at a time on the same scales, then asks which one people would choose and why.
Newsletter reader survey on topics, frequency and format
A newsletter reader survey asks subscribers what they want more of, how often they want it and how they read it, so the next issues fit their week. This one does it in seven screens for a weekly money newsletter, ending with a single question on interest in a paid tier.
Supplier feedback survey: how your suppliers rate you as a customer
A supplier feedback survey asks the businesses that sell to you how you are to work with: whether you pay on time, forecast honestly and answer the phone. This one turns that into seven screens for a food manufacturer's procurement team, ending with whether each supplier wants to keep the account.
Want the steps in the builder? Read Create a conversational form with AI, then View, export and manage your responses. For everything this generator can do, see the form maker.
Written and checked by the OneCraft team. Last checked .