Conversational form
Product feedback survey template with a feature importance matrix
A product feedback survey has to find out which features customers rely on and what is missing, segmented by who they are and how long they have used the product. This template asks tenure, role and main use first, then puts six features into one importance grid, and closes with price fairness and a recommendation score.
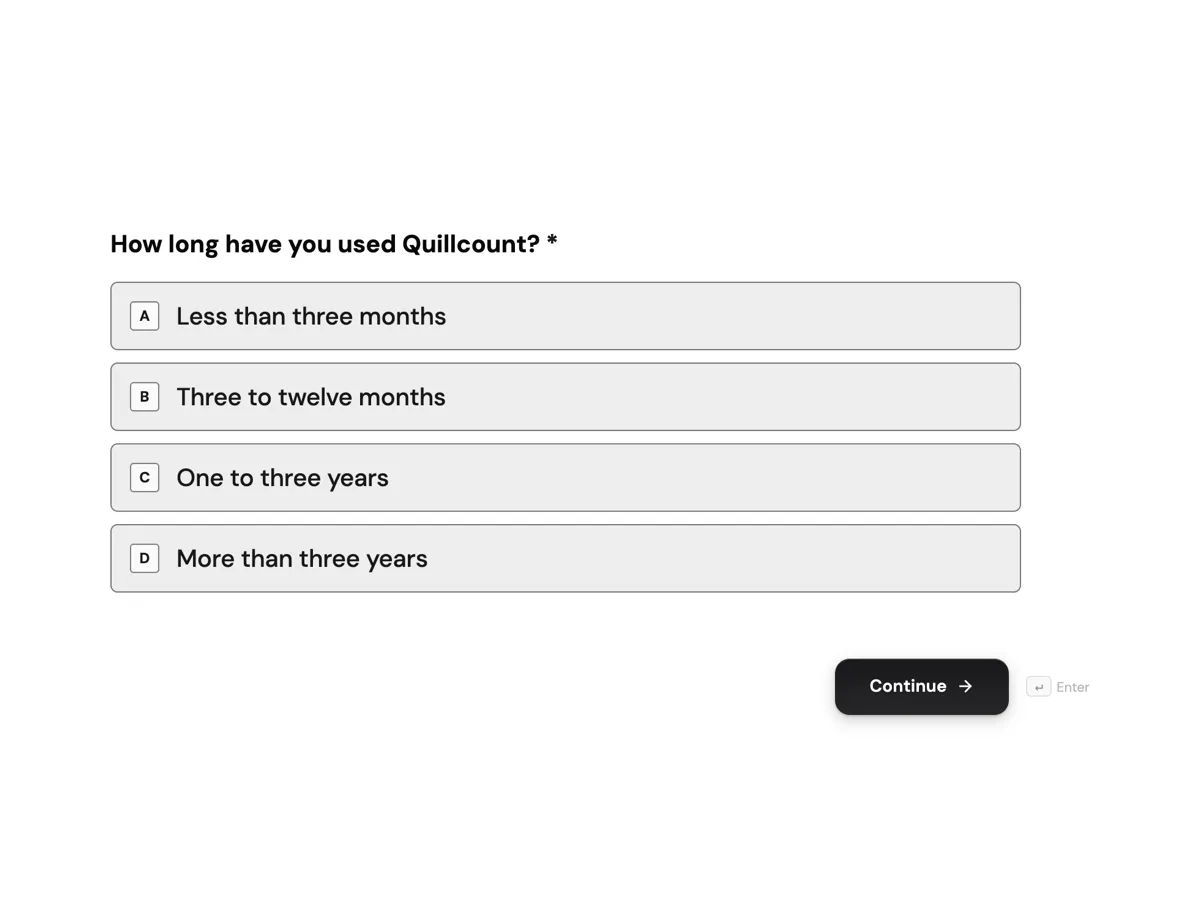
The form itself
The first screen of the form. A conversational form shows one question per screen, so the remaining screens are listed in the field table below. Nothing here can be filled in or submitted, so read it as a reference and build your own from the button above.
Every field, and what it collects
The complete field list, in the order respondents meet it.
- How long have you used Quillcount?Single choiceRequired
- Options: Less than three months · Three to twelve months · One to three years · More than three years
- Which best describes you?Single choiceRequired
- Options: Sole trader or freelancer · Small business owner with staff · Bookkeeper or accountant for clients
- What do you use Quillcount for most?DropdownRequired
- Options: Sending invoices · Matching bank transactions · Tracking expenses and receipts · Preparing tax returns · Paying staff
- Overall, how satisfied are you with Quillcount?Single choiceRequired
- Options: Very satisfied · Satisfied · Neither satisfied nor dissatisfied · Dissatisfied · Very dissatisfied
- How important is each feature to your work?Rating gridRequired
- Rate the ones you use. Choose not used for any you have never tried.
- Statements:
- Invoice templates
- Bank feed matching
- Receipt capture by photo
- Expense categories
- Tax return summary
- Multi user access
- What is the one thing Quillcount does not do that you need?Long text
- For what you get, is the price fair?Single choiceRequired
- Options: Good value · About right · A bit expensive · Too expensive
- How likely are you to recommend Quillcount to someone in your position?Single choiceRequired
- 0 is not at all likely, 10 is extremely likely.
- Options: 0 · 1 · 2 · 3 · 4 · 5 · 6 · 7 · 8 · 9 · 10
- What is the main reason for that score?Long text
What each screen of this survey asks
Tenure is a radio of four bands, from under three months to more than three years. Role is a radio of three: sole trader, small business with staff, or bookkeeper for clients. Main use is a dropdown of five jobs. Satisfaction is a five point scale. The feature grid is a matrix of six features against five columns, not used, low, medium, high and essential. The missing feature is a long text with a concrete placeholder. Price fairness is a radio of four. Likelihood to recommend runs 0 to 10 in three columns, and a final long text asks for the reason. Seven of the nine screens are required; the two open answers are optional.
Why the feature grid has a not used column
Asked to rate importance, people rate everything high, including features they have never opened. A not used column gives them an honest way out, and it also measures adoption: if most bookkeepers mark multi user access as not used, that is a discovery problem, not a low priority feature. Reading the grid by role is where it pays off. Sole traders and accountants use the same product for different jobs, so the tenure and role screens at the start are what turn one grid into three useful ones. A required matrix in this product is satisfied when any one row is answered, so the help text asks people to rate the ones they use.
How to adapt this survey
A hardware product replaces the feature list with physical attributes such as battery life and weight. A product with a free plan adds a plan question so price fairness is read by what people pay. A team testing a roadmap replaces current features with planned ones and the columns with how much each would help.
What makes this form work
Not used is a real answer
The six feature grid starts with a not used column. Importance ratings stay honest, and the share marking a feature unused shows which ones customers never found.
Segments are asked first
Tenure, role and main use come before any rating. Every answer about satisfaction, features or price can be read for sole traders, small businesses and accountants separately.
A score always has a reason
The 0 to 10 question is followed by the main reason for that score, with a concrete placeholder. A detractor arrives with something the team can change.
Questions people ask
What is a feature importance matrix?
A grid that lists features as rows and an importance scale as columns, so respondents rate all of them on one screen with the same scale. It is faster than one question per feature and keeps ratings comparable. This one has six features and five columns, including not used, which keeps unused features from being rated important.
Should a product survey include a 0 to 10 recommendation question?
It is common, and useful when tracked over time with the reason behind each score. On its own the number says little about what to change. This survey follows it with a required score and an optional open question on the main reason, so a low score arrives with an explanation.
Why ask tenure and role at the start?
So every later answer can be split by who gave it. A new customer and a three year customer rate the same feature differently, and an accountant serving clients needs different things from a freelancer. Asking first means even a partial set of answers is segmented, and the questions are easy warm ups.
Does every row of the matrix have to be rated?
No. The matrix is required, but the product counts a required matrix as answered once any one row has a choice. That suits this grid, because the help text asks people to rate only the features they use and mark the rest not used. Analysis should treat a blank row as no answer.
How often should a product feedback survey go out?
Once or twice a year to the whole customer base, or quarterly to a rotating sample, so nobody is asked too often. The thank-you screen promises a quarterly summary, which is what keeps response rates up next time. Surveys sent after every release tend to measure fatigue rather than the product.
How should the price fairness answers be used?
Read them by role and tenure, not as one number. Accountants paying for many clients and sole traders paying for one often see the same price very differently. A rising share of a bit expensive among long term customers is an early warning that a competitor is quoting them.
Build your own in about a minute
The button below opens the generator with this use case already described. Change the wording to match your own, generate, then edit anything you like.
Make one like thisOther form examples
Cancellation survey with a main reason and a pause offer
A cancellation survey has to capture why a subscriber is leaving in a form the business can act on, while the decision is still fresh. This one asks for a single main reason, then what would have kept them, where they are going instead, and whether a pause would do.
Customer effort score survey template for closed support tickets
A customer effort score survey asks how easy it was to get an issue handled, on a seven point agreement scale, straight after the ticket closes. This template pairs that one statement with the ticket number, the channel, what got in the way, whether the issue is actually fixed and how many contacts it took.
Restaurant feedback form with a course by course rating grid
A restaurant feedback form has to tell the kitchen and the floor team which part of a visit worked and which did not, without making diners write an essay. This one puts every course plus service, ambience and value into one rating grid, then asks for the server, the best dish and whether they would return.
Want the steps in the builder? Read Create a conversational form with AI, then View, export and manage your responses. For everything this generator can do, see the form maker.
Written and checked by the OneCraft team. Last checked .