Presentations
Diagram slides
A diagram here is a list of labelled items and a decision about how to arrange them. Twelve arrangements are available and they all read the same list, so a funnel becomes a pyramid without you retyping anything.
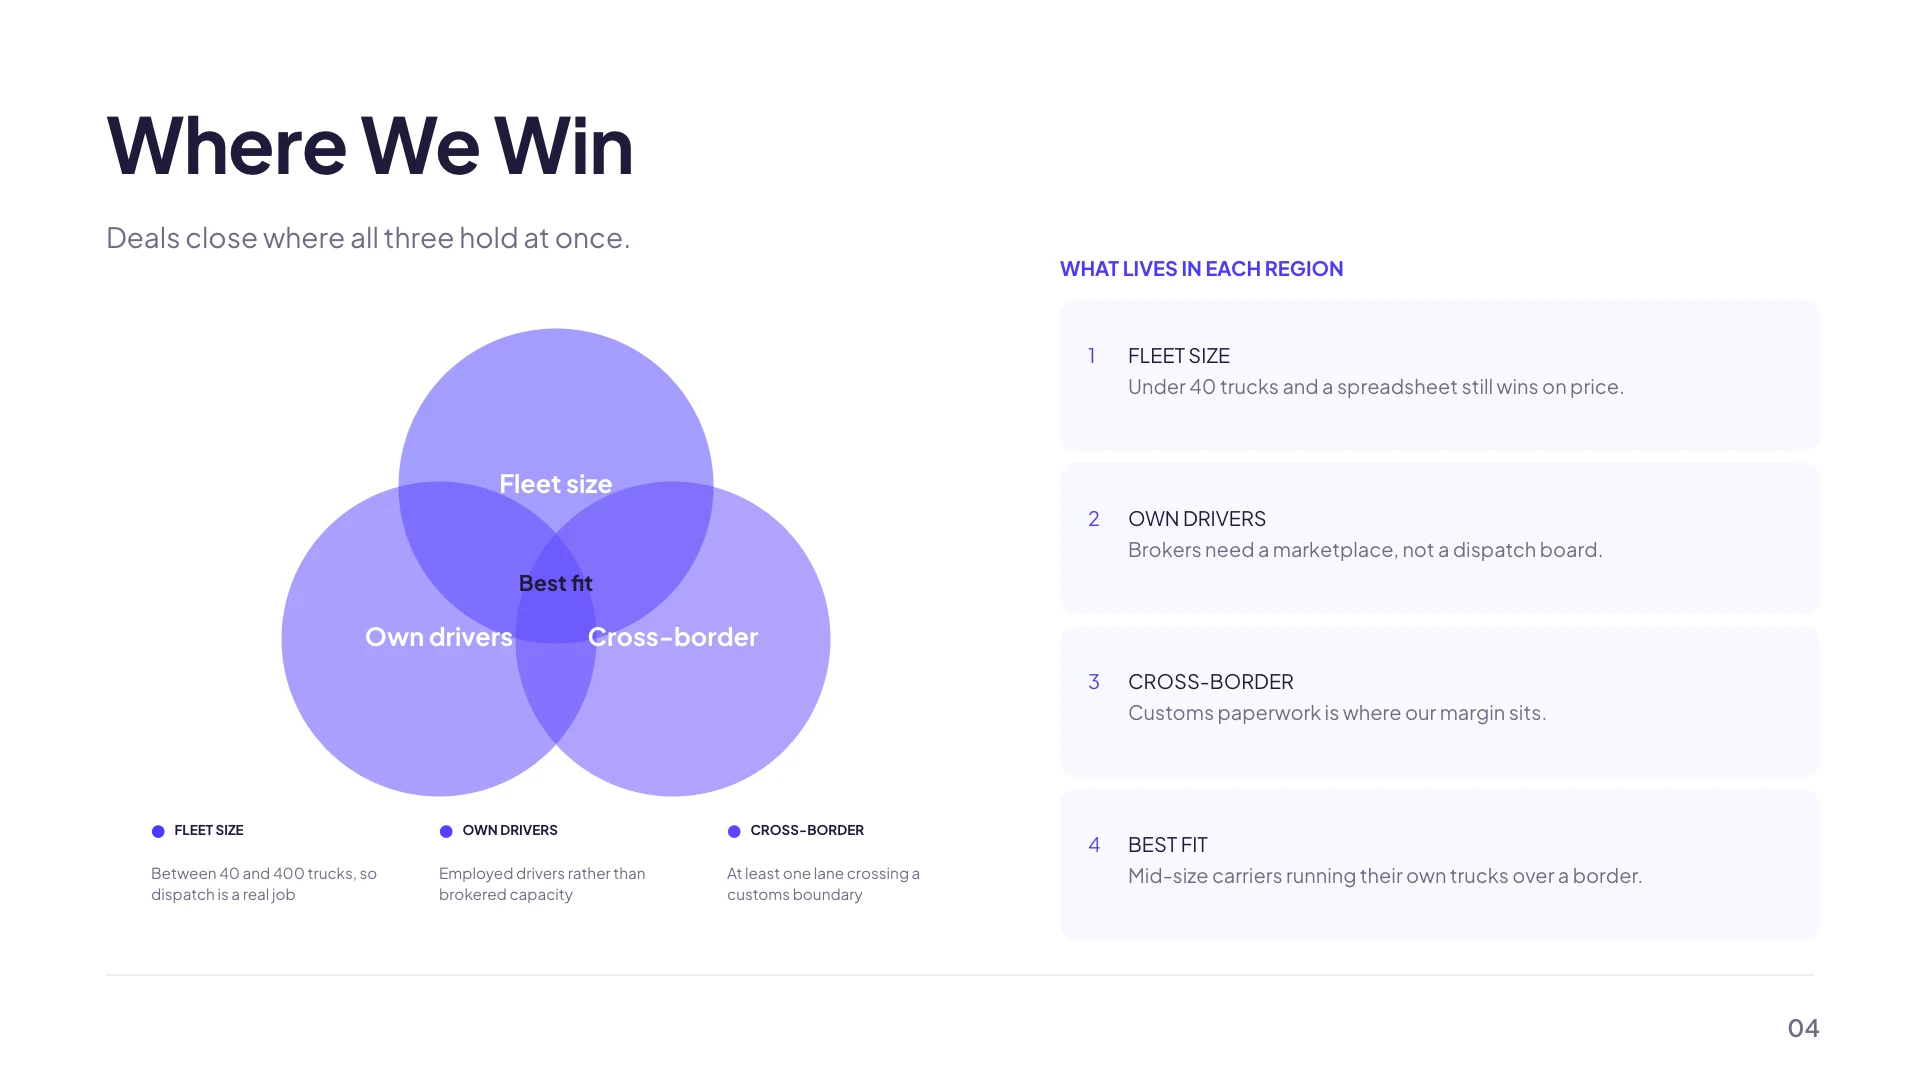
The twelve, and what each one asserts
Pyramid says these are layered with one at the base. Funnel says these narrow in sequence. Cycle says these repeat with no end. Concentric says these are nested around a core. Venn with two or three sets says these overlap. Honeycomb says these are peers with no order. Fishbone says these are causes of one effect. Five forces says these press on a market. Org chart says these report upward. Kano plots features against satisfaction. Gap analysis puts a current state beside a desired one. The shape is an argument, so choose it for what you are claiming.
Three of them want a centre
Concentric, five forces and the org chart all have a hub the other items relate to, so the editor gives those an extra Root node field. Leave it empty on a five forces diagram and you get five items pointing at nothing. Fill it with the market, the core belief or the person at the top and the drawing suddenly says something.
Three of them take sub items
Org chart, fishbone and gap analysis accept children under each item, capped at four for the org chart and three for the other two. That is where a fishbone earns its keep: the four bones are the categories and the children under them are the specific causes. The other nine shapes are deliberately one level, because a nested Venn diagram is not a thing anybody can read from a seat.
Item counts have a soft ceiling
Six items is the default budget and layouts can set their own. Venn with two sets means two, Venn with three means three, and five forces means five, which is why those seed with exactly that many. Honeycomb holds more than a cycle before it gets cramped. If a shape starts looking crowded, the answer is usually fewer items rather than a smaller font.
Where they come from
Twenty five of the 1,071 layouts, the ones filed under the diagram purpose, arrive with a diagram already positioned and sized for the design. Beyond those, the element library has a tile for each of the twelve, and one you drop yourself can be switched between all twelve afterwards. A diagram that came with a layout offers only the shapes that layout declares, because a design built around a wide funnel does not hold an org chart.
How it works, in three steps
Step 1
Choose the shape from what you are claiming
Sequence, overlap, hierarchy, repetition or cause. The shape is the argument, so pick it before you write the labels.
Step 2
Write short labels
One to four words each. The description line under a label is where the sentence goes, not in the label itself.
Step 3
Fill the root node if the shape has one
Concentric, five forces and the org chart all read as unfinished without it.
The full walkthrough with screenshots is in the guide Add charts, maps and diagrams to slides.
Limits worth knowing
- Twelve shapes in the element library. A thirteenth exists inside layouts but has no tile of its own.
- Only the org chart, fishbone and gap analysis accept sub items, and only three or four of them.
- Six items is the default ceiling per diagram, and specific shapes hold fewer.
- In an editable PowerPoint export the diagram artwork stays a picture, although its labels become real text boxes.
See it on a finished piece


Slide examples
Finished single slides on this layout, each one built from a real template and written out in full.
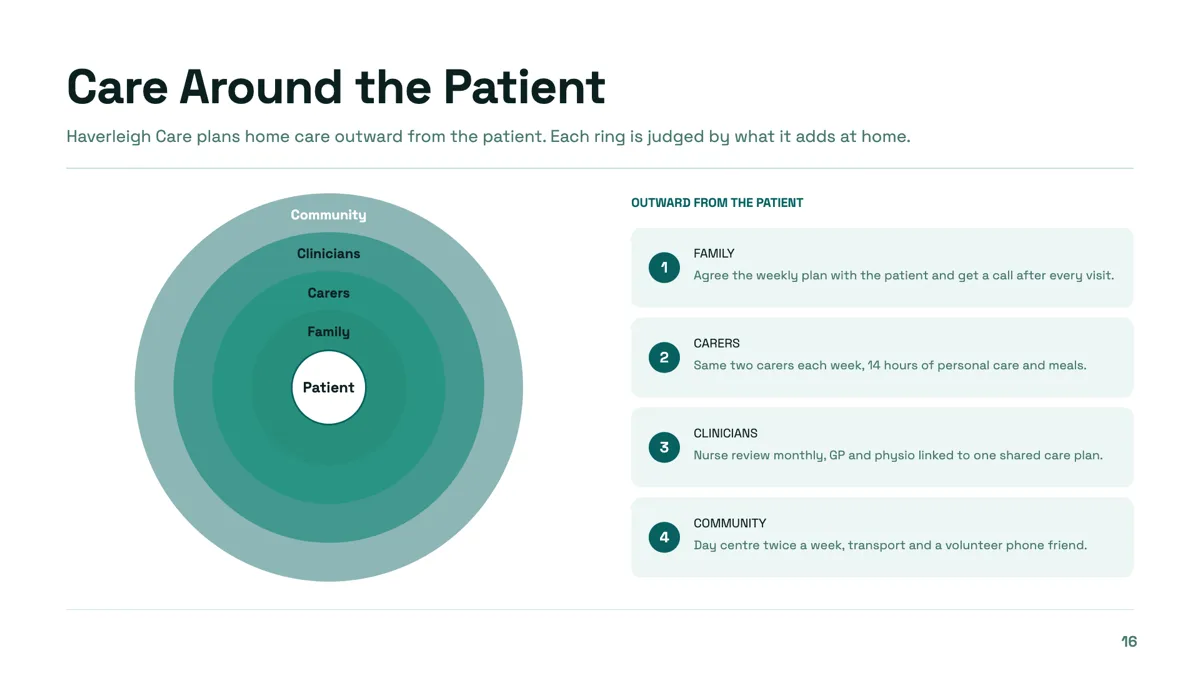
Concentric circles slide with the patient at the core
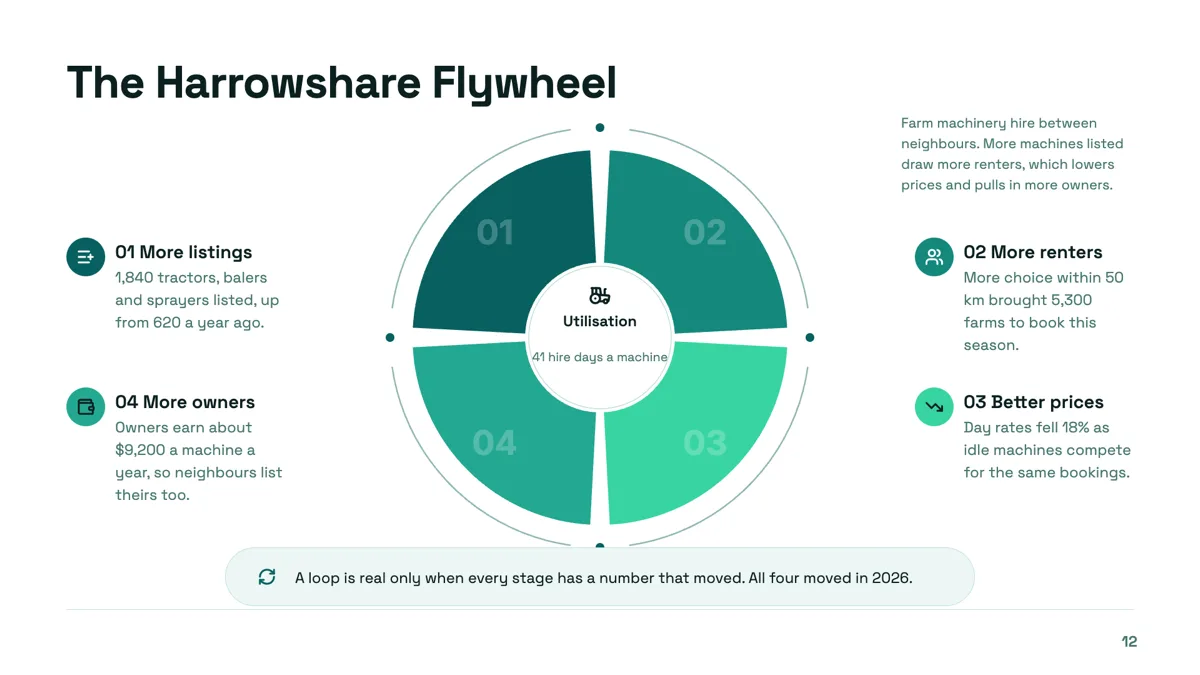
Flywheel slide where every stage has a number that moved
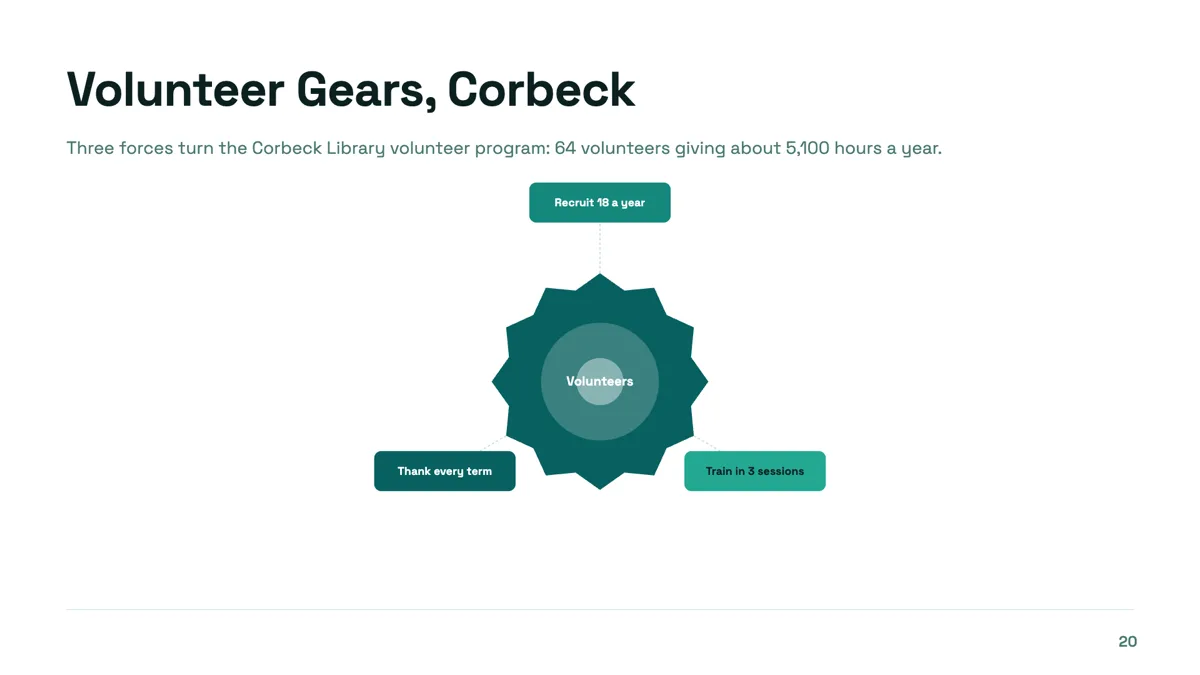
Gears diagram slide with three forces around one engine
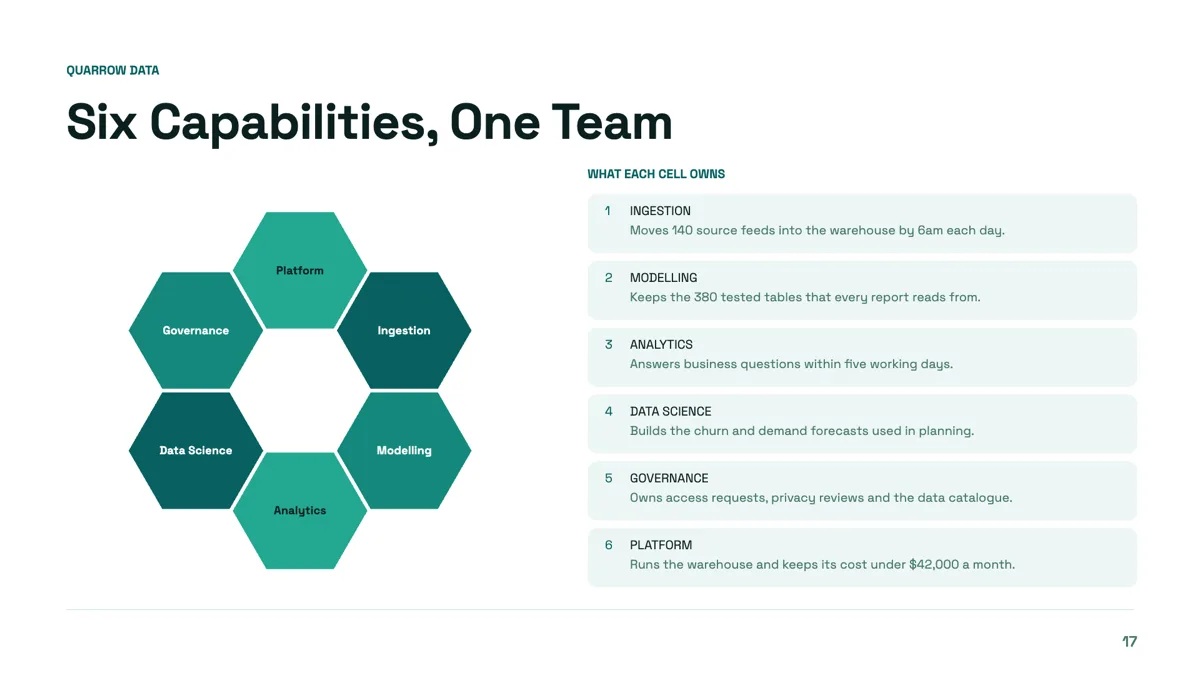
Honeycomb slide with six peer capabilities and their scope
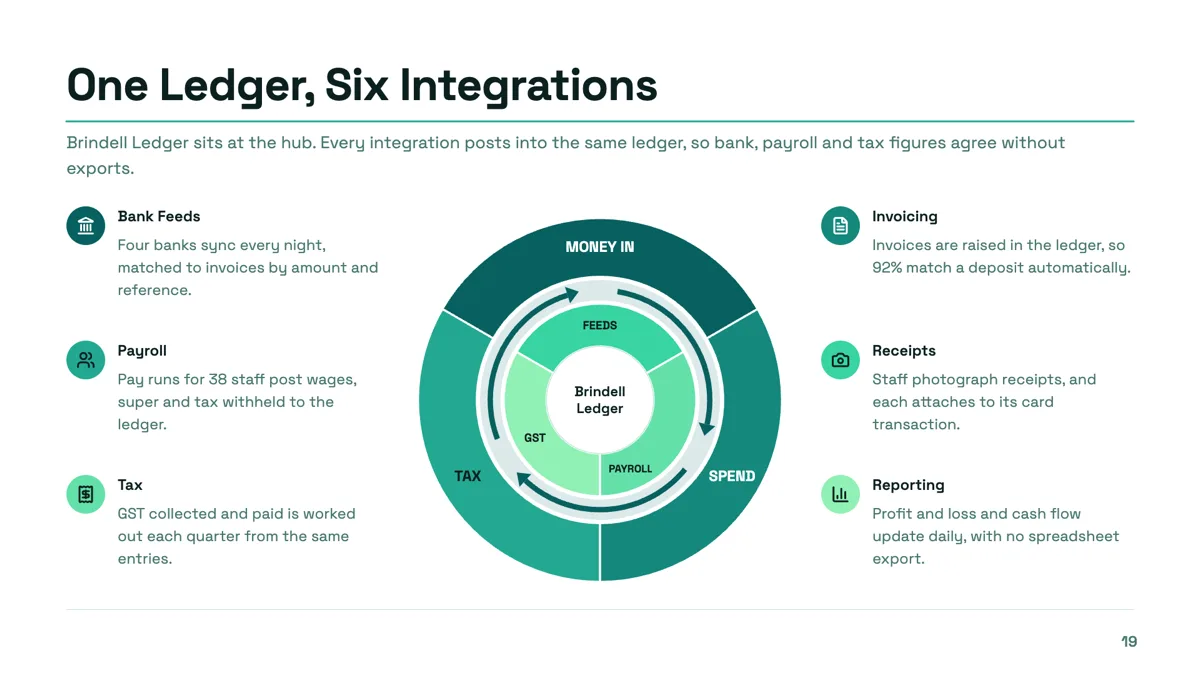
Hub and spoke slide with one ledger at the centre
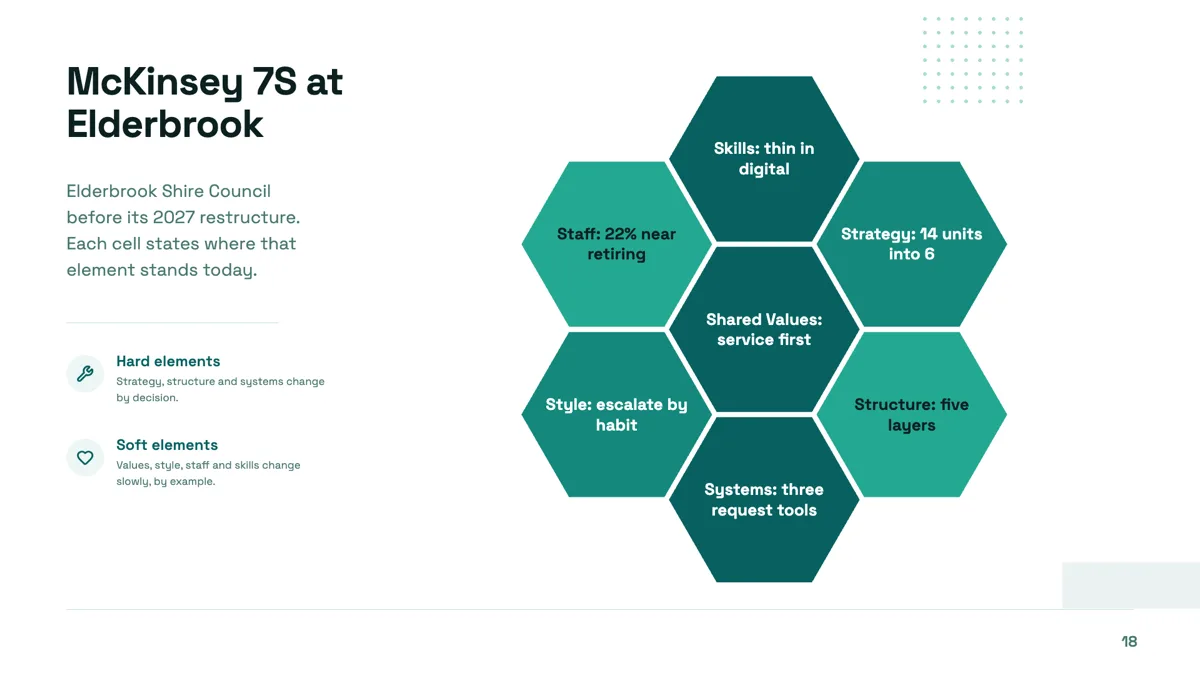
McKinsey 7S slide with the current state in every cell
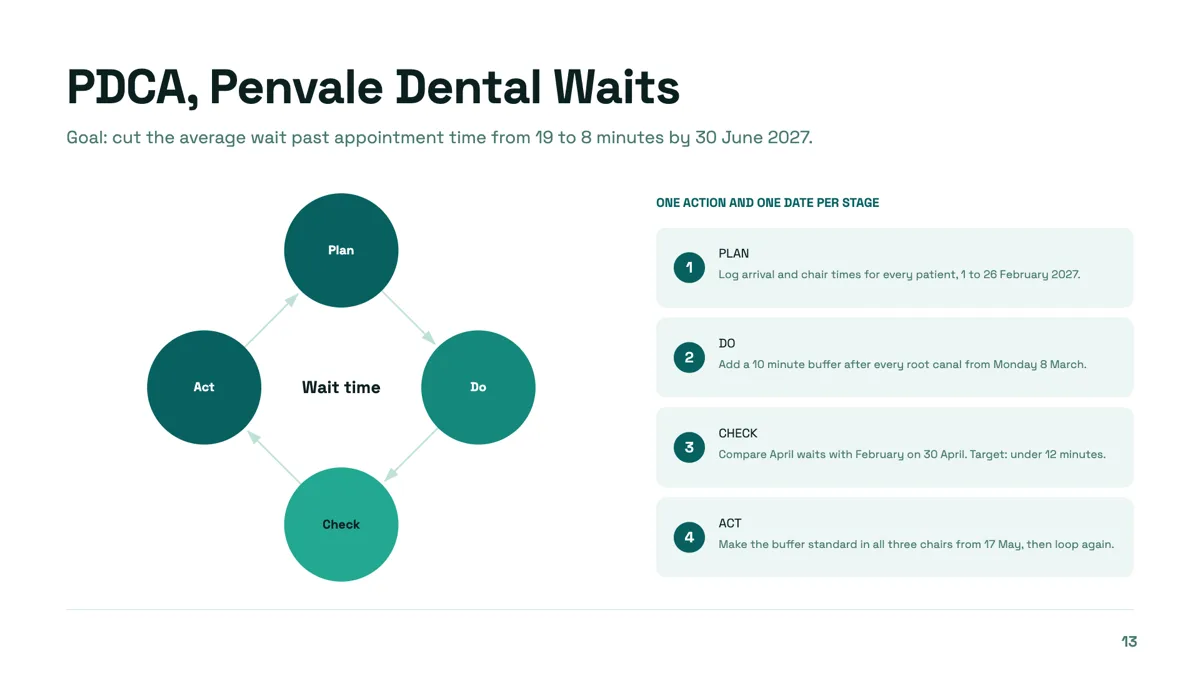
PDCA cycle slide with one action and one date per stage
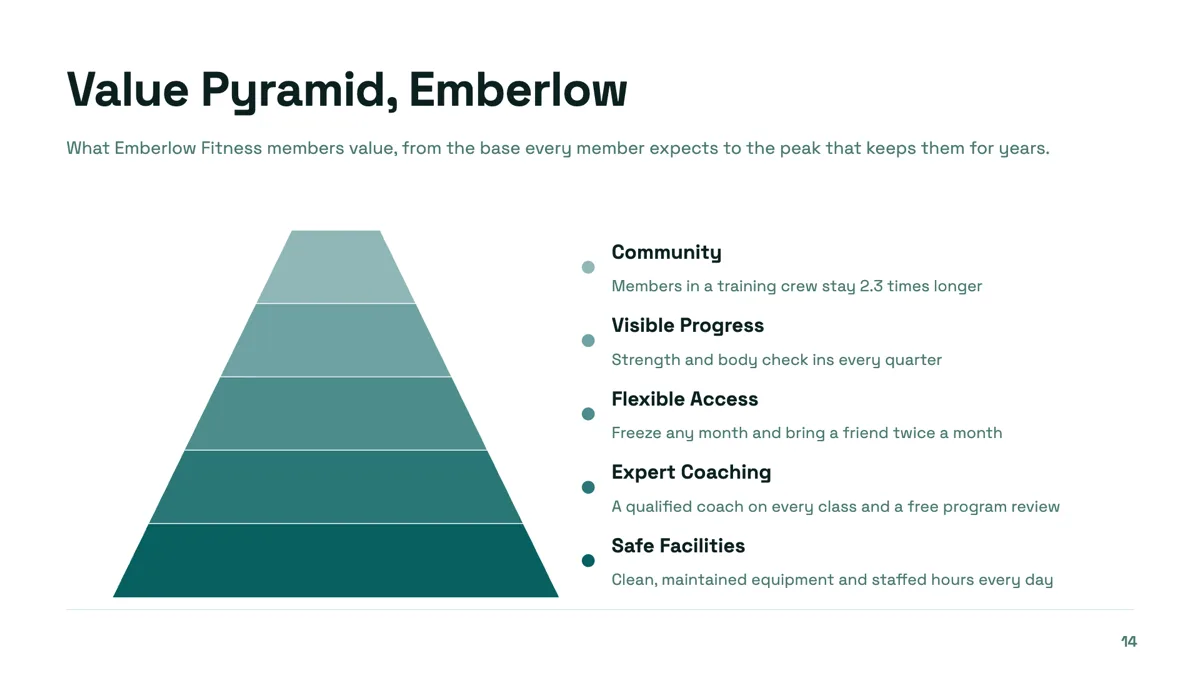
Pyramid slide with five levels from base to peak
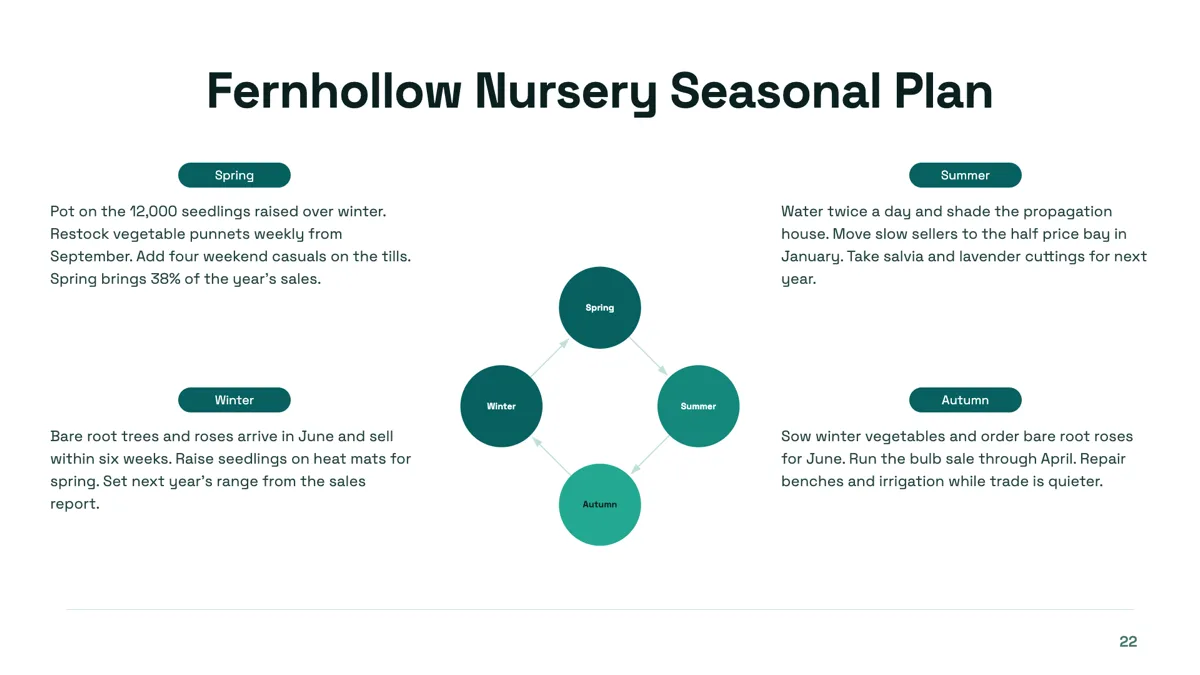
Quadrant cycle slide with a season in every corner
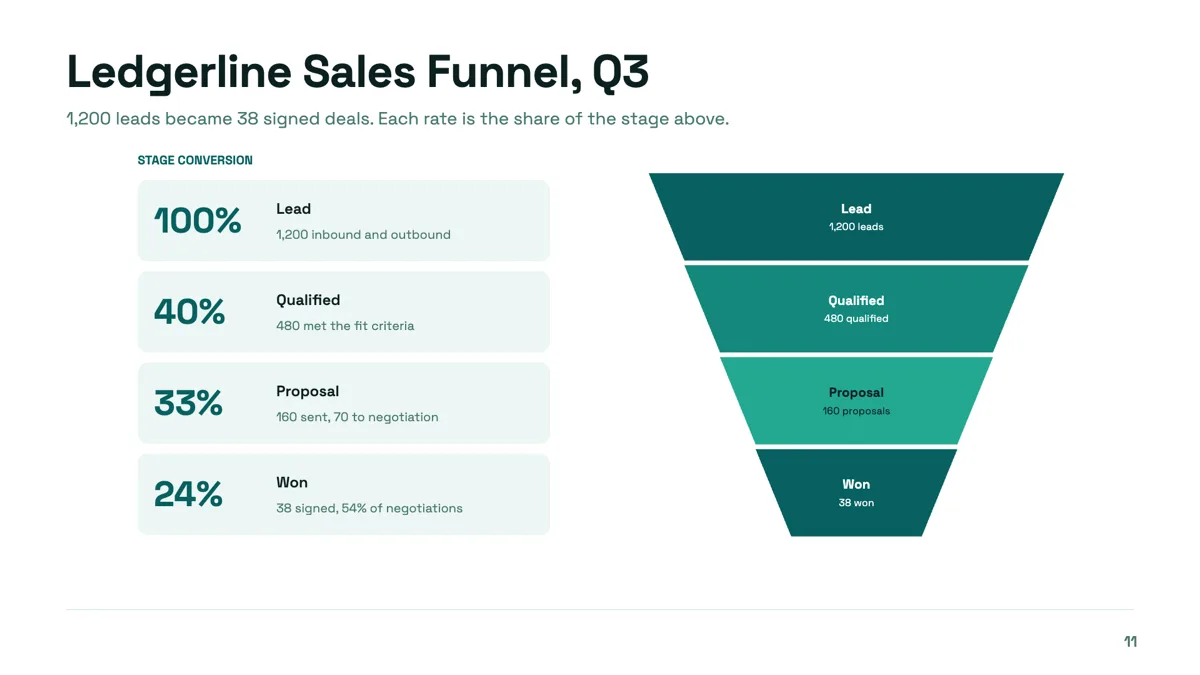
Sales funnel diagram slide with conversion rates on the rail
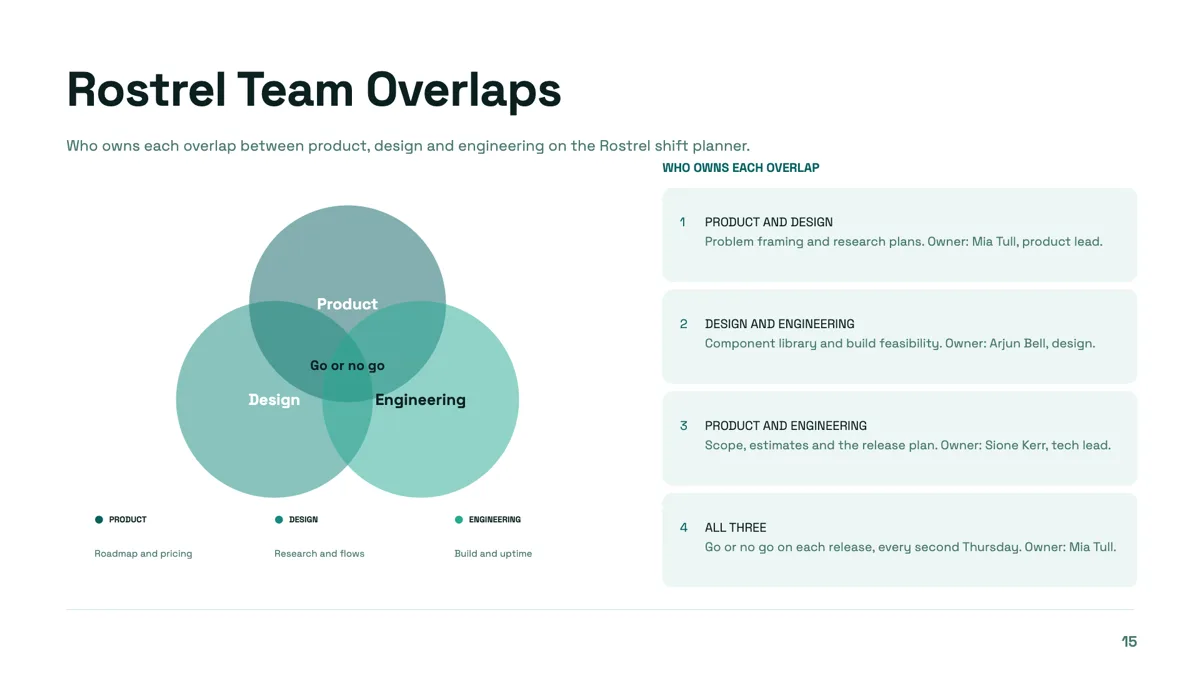
Three circle Venn slide with every overlap owned
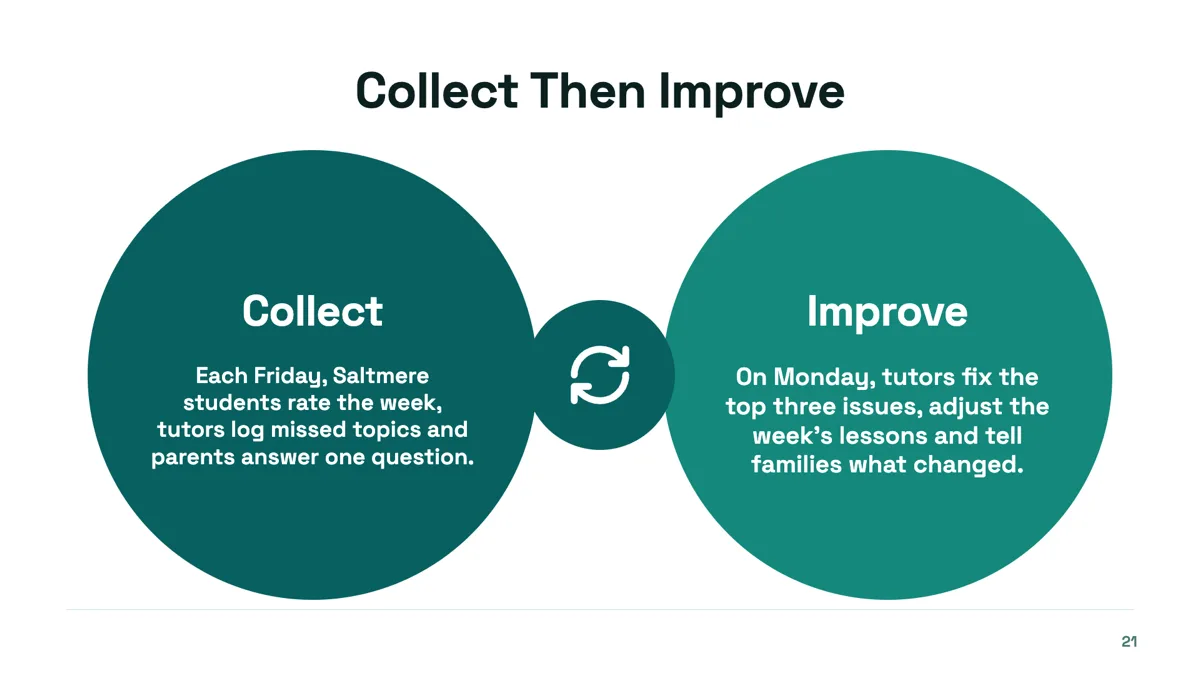
Two step cycle slide for the smallest feedback loop
Questions people ask
Can I switch a funnel to a pyramid without retyping?
Yes. All twelve read the same list of items, so the shape is a display choice. A diagram you dropped yourself offers all twelve in its picker.
Why does my five forces diagram look empty in the middle?
Because the Root node field is blank. Concentric, five forces and the org chart all hub around a centre and read as unfinished without one.
How many levels deep can an org chart go?
Three levels: a root box, a row of up to six under it, and up to four leaf pills beneath each of those. Anything deeper belongs on a tree layout or across two slides.
Do diagrams follow the theme?
Yes. Segment fills, strokes and label colours all come from theme tokens, so swapping the theme recolours every diagram in the deck at once.
Make your own presentation
The button opens the generator with this use case already described. Change the wording to match yours, generate, then edit anything you like.
Create a presentation with OneCraftRelated pages
AI image generation for slides
Every picture box on a slide can be filled by describing what should be in it. The generated image is requested at the aspect ratio of the box, so it arrives filling the space rather than being cropped into it, and every attempt stays in the deck for you to compare and reuse.
Quiz slide templates
A quiz slide in a deck is not an interactive quiz. Nobody clicks an answer and gets a score. It is a question held on screen while a room answers out loud, followed by a slide that shows which answer was right. That is a smaller thing than a quiz app and a very useful thing in a training session.
Intro slides
The slide after the cover has to give the audience a reason to keep listening, which is a different job from naming the deck. Eleven layouts are filed under the intro role, covering why now arguments, manifesto statements, company overviews and split openers with a photograph.
More finished work of this kind is on the presentation examples hub.
Written and checked by the OneCraft team. Last checked .