Presentations
Flowchart slides
A flowchart is the one diagram where the connections carry as much meaning as the boxes. This component treats them that way: nodes and connections are separate lists, positions are computed for you, and then you move things until it reads.
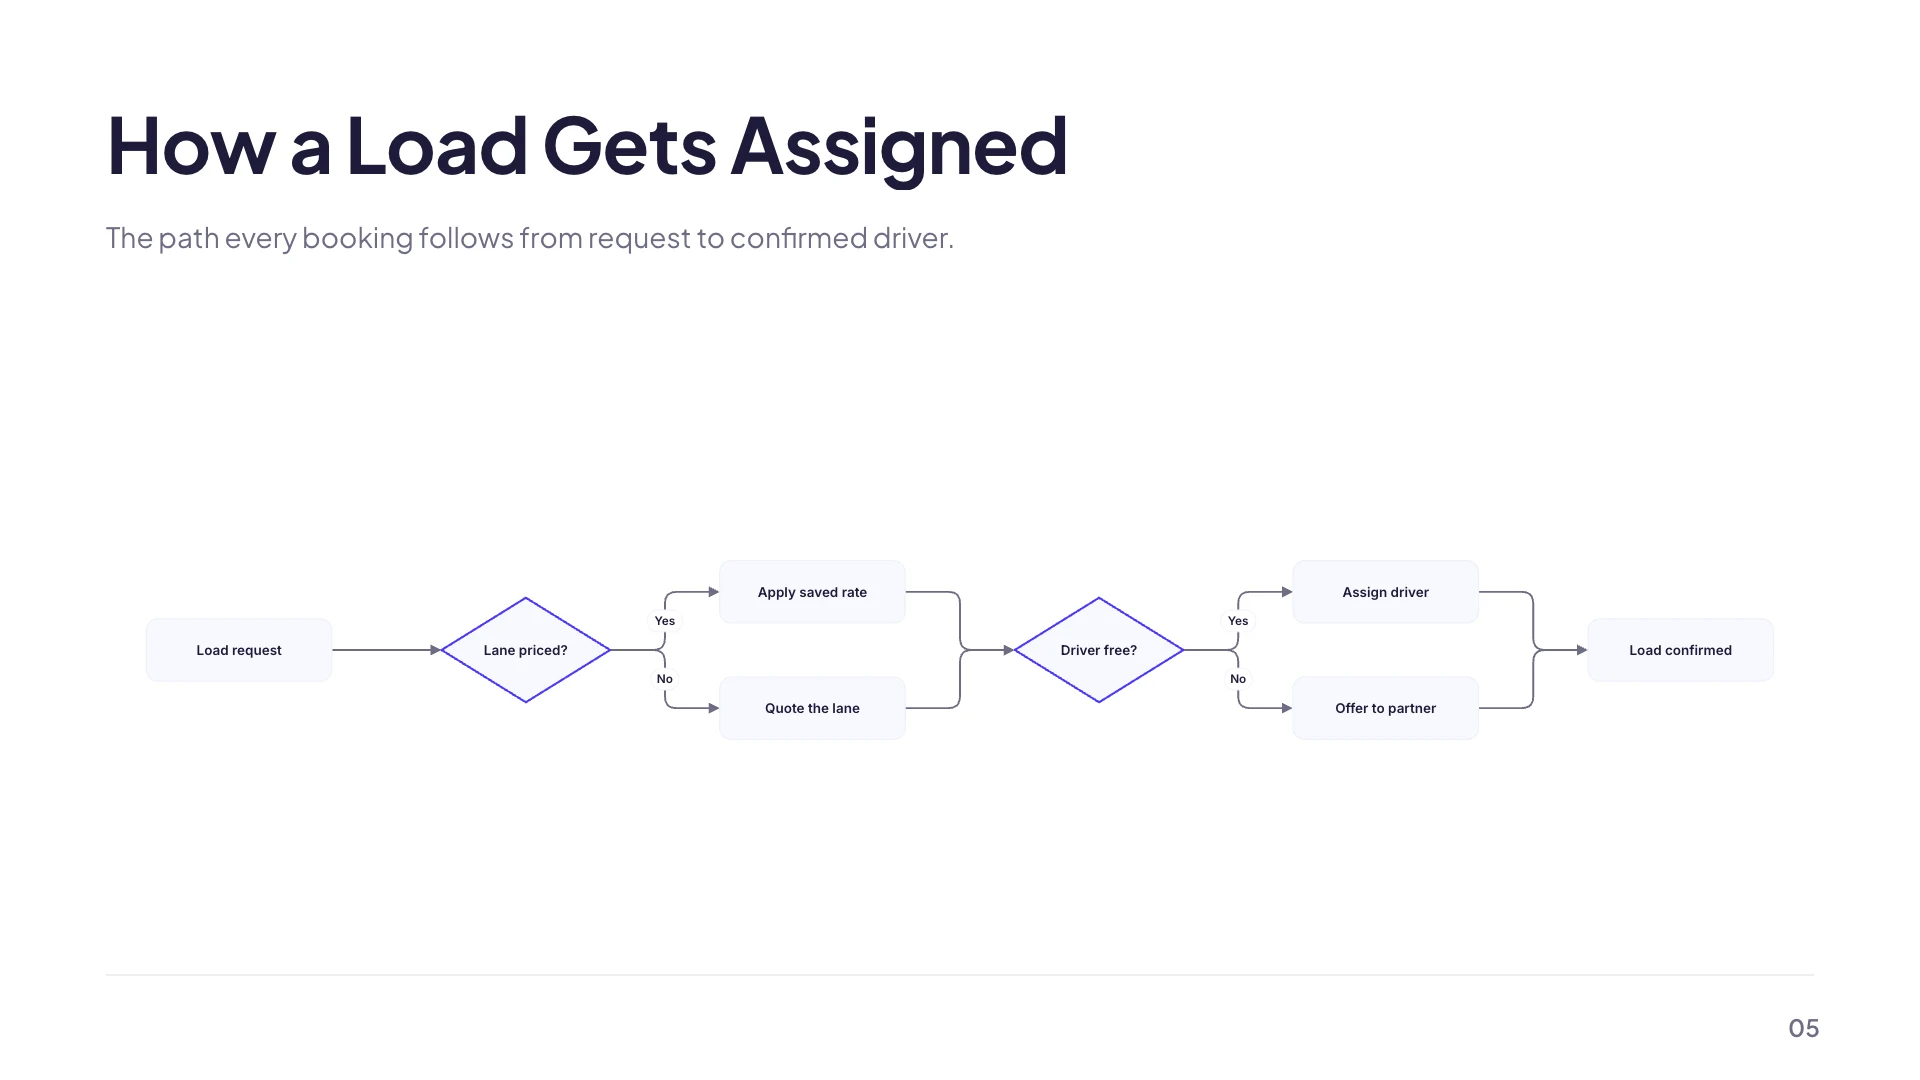
Four shapes, and they mean different things
Rect for a step. Pill for a start or an end. Decision for a diamond where the flow branches. Circle for a connector or an on page reference. Shape is set per node from the inspector, and the convention is worth respecting because an audience reads a diamond as a question before they read the words inside it.
Connections are their own list
Adding a connection picks two nodes and joins them, and each connection can carry a label, which is where Yes and No go on a decision branch. Because connections are stored separately from nodes, deleting a step does not silently rewire the flow around it. You can also draw one directly on the canvas by dragging from a port on the node you hover.
Auto layout first, then drag
An Auto button in the inspector runs a layered layout over the graph and places every node, which is the fastest way to get from a list of steps to something readable. After that, dragging a node on the canvas moves it and the position sticks, so the usual workflow is auto layout once and then nudge the two or three boxes the algorithm put in an awkward place.
Twenty nodes is the ceiling, twelve is the readable one
A flowchart you drop yourself accepts up to twenty nodes and the count is shown live in the inspector as you add them. The one flowchart layout in the library caps at twelve, which is closer to what actually reads on a projected slide. Past a dozen boxes the type has shrunk enough that the audience stops following the arrows and starts waiting for you to explain it.
When a process is linear, do not use this
Seventeen layouts are filed under process, and fifteen of them are built for a sequence of stages rather than a branching graph; only the decision flowchart and the two row flow carry a real flowchart. A five step onboarding flow with no decisions in it reads better as a numbered process layout, because the arrows are implied by the order and you get more room for the description under each step. Reach for the flowchart when there is a genuine branch.
How it works, in three steps
Step 1
List the steps as nodes
Add a node per step and set its shape. Diamonds for questions, pills for the start and the end.
Step 2
Join them
Add a connection between two nodes, or drag from a port on the canvas. Label the branches out of a diamond.
Step 3
Hit Auto, then tidy
The layout button places everything. Drag the two or three boxes it got wrong and the positions stay put.
The full walkthrough with screenshots is in the guide Add charts, maps and diagrams to slides.
Limits worth knowing
- Twenty nodes maximum on a flowchart you add yourself, twelve on the library layout.
- Connections are straight lines between nodes. There is no waypoint editing or manual routing.
- There is no swimlane. A cross team process needs the lanes expressed as node labels or a second slide.
- In an editable PowerPoint export the flowchart stays a picture, although its node and connection labels become real text boxes.
See it on a finished piece


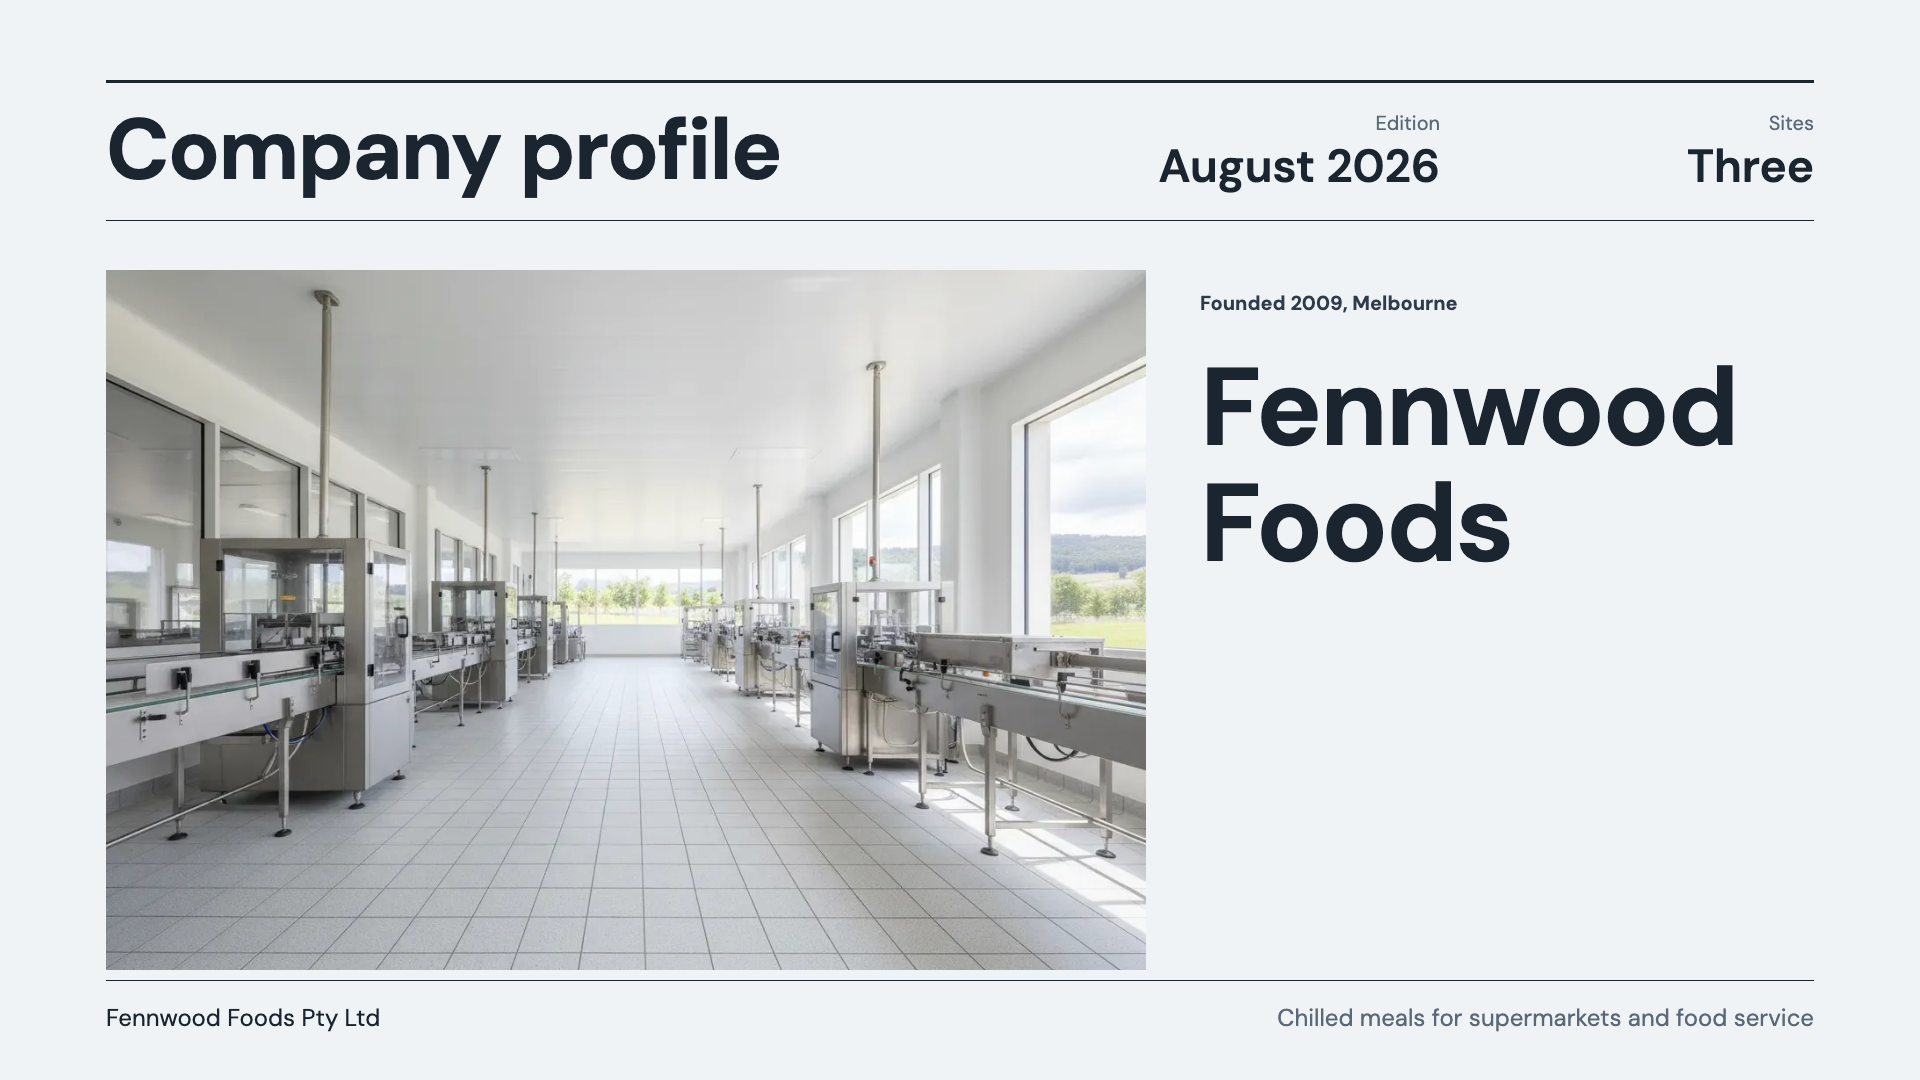
Slide examples
Finished single slides on this layout, each one built from a real template and written out in full.
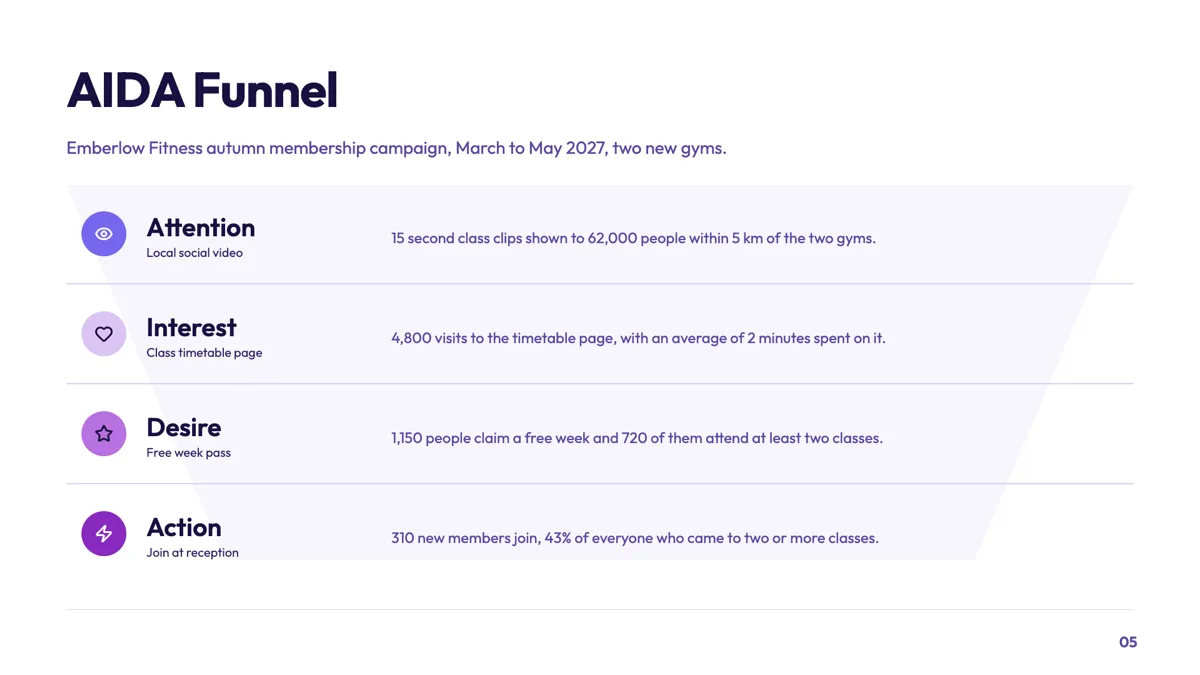
AIDA slide mapping each campaign channel to a stage
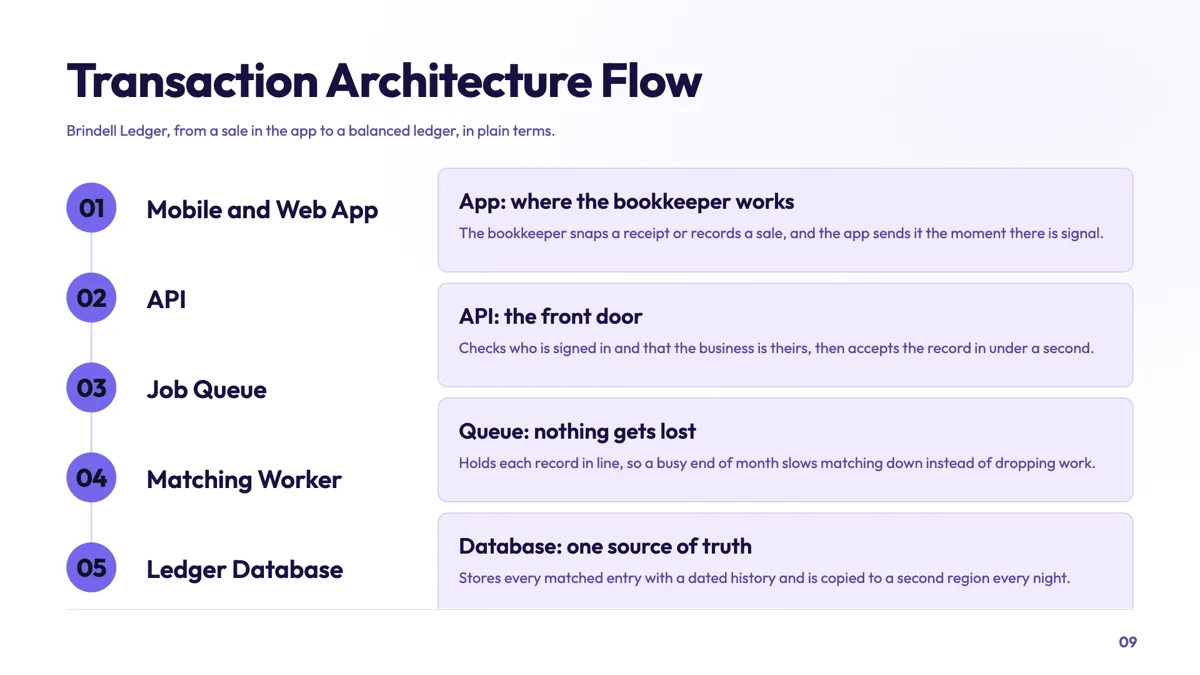
Architecture flow slide a non technical board can follow
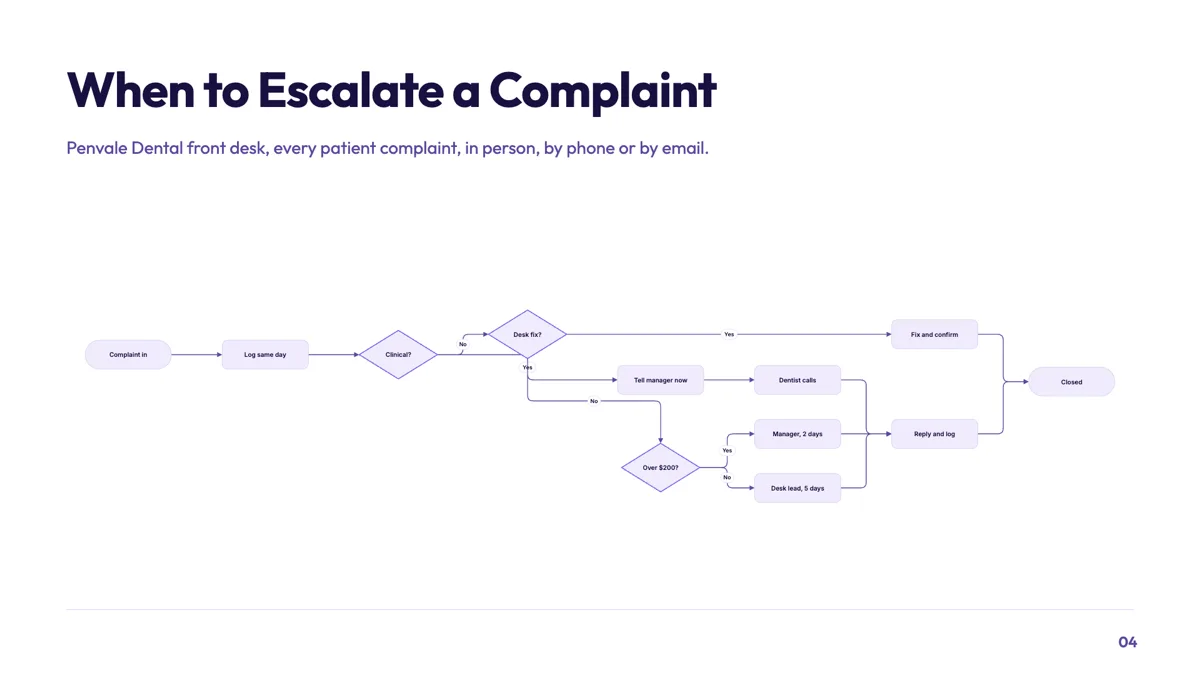
Decision flowchart slide for escalating a patient complaint
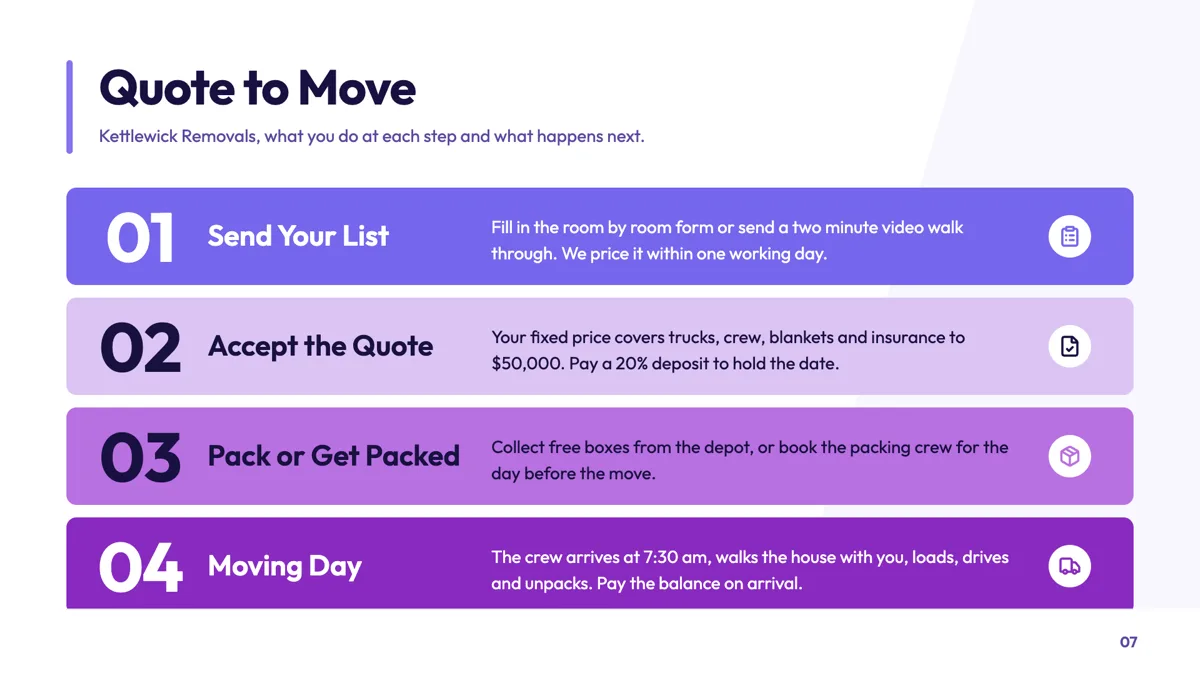
Four step process slide written for the customer
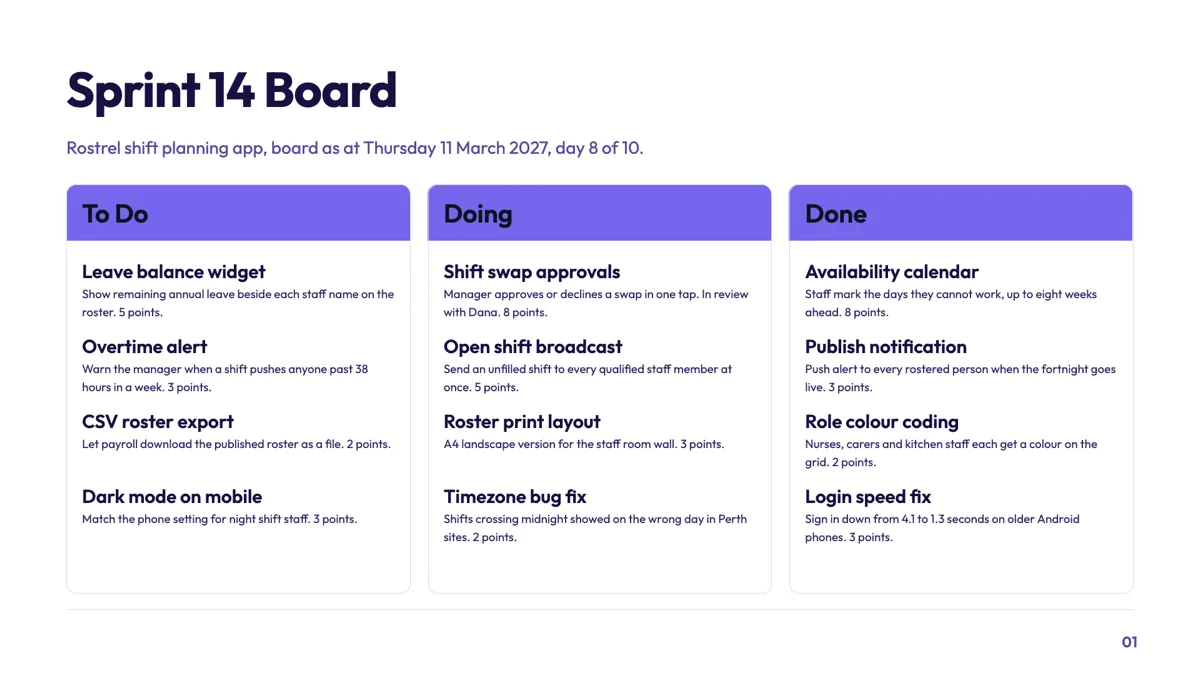
Kanban slide showing a sprint board on a single date
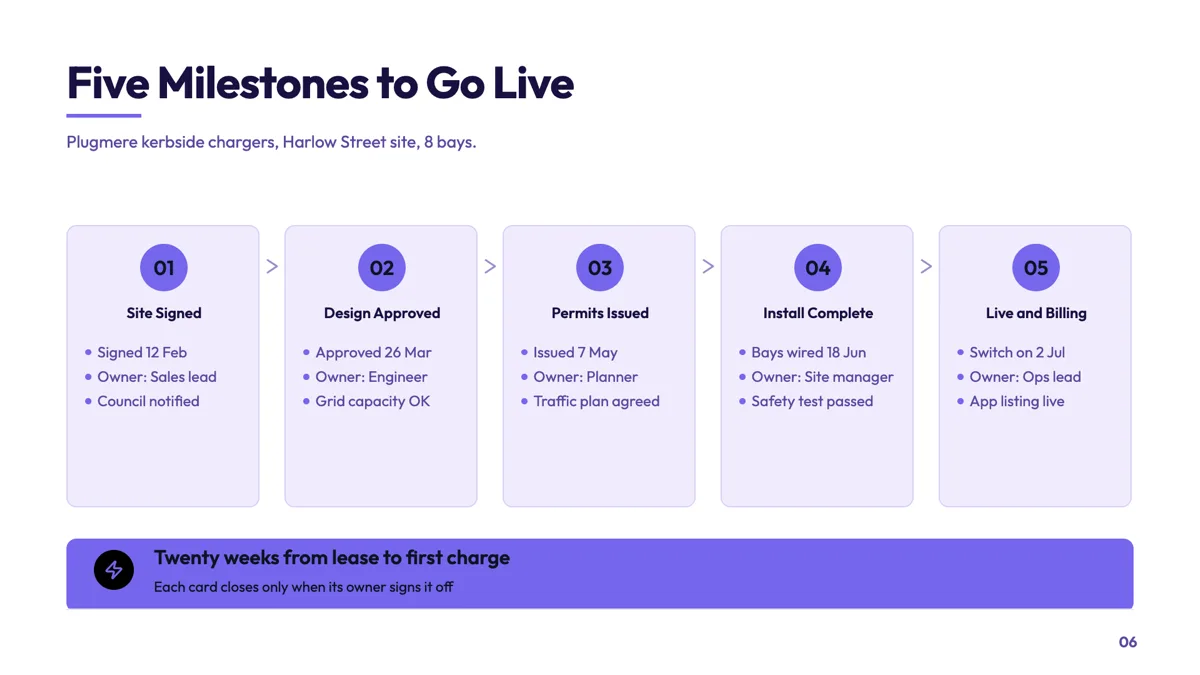
Milestone pipeline slide with a date and owner on each card
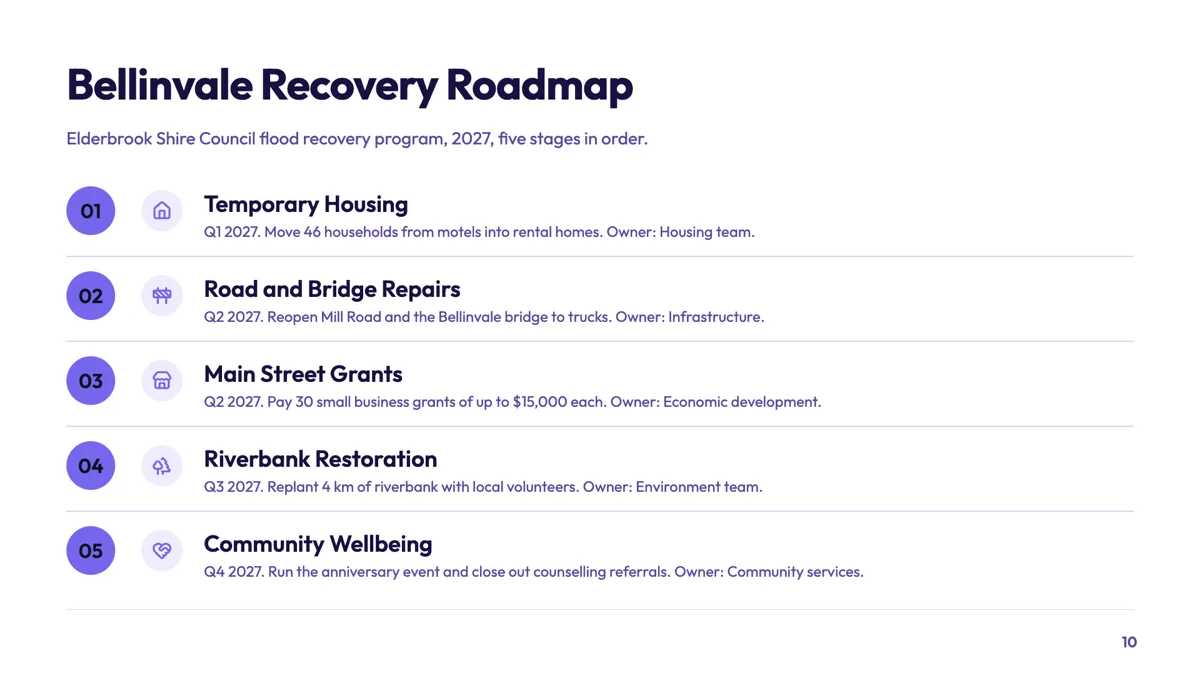
Numbered roadmap slide with a quarter and owner per row
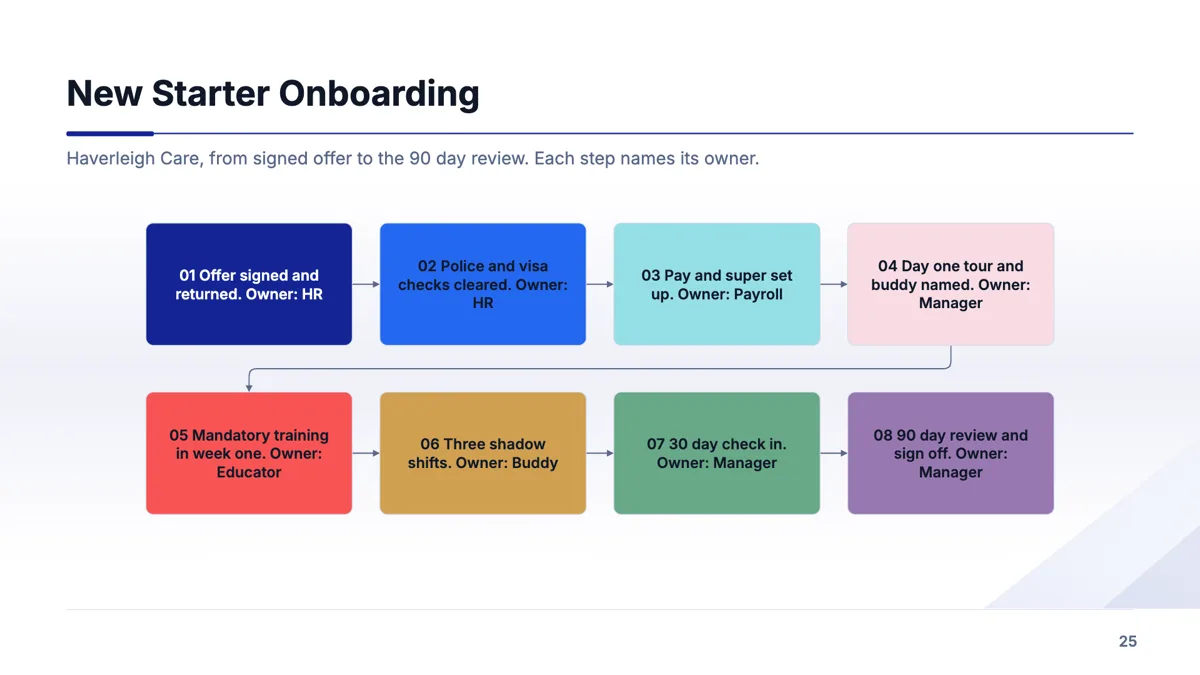
Onboarding process slide with an owner on every step
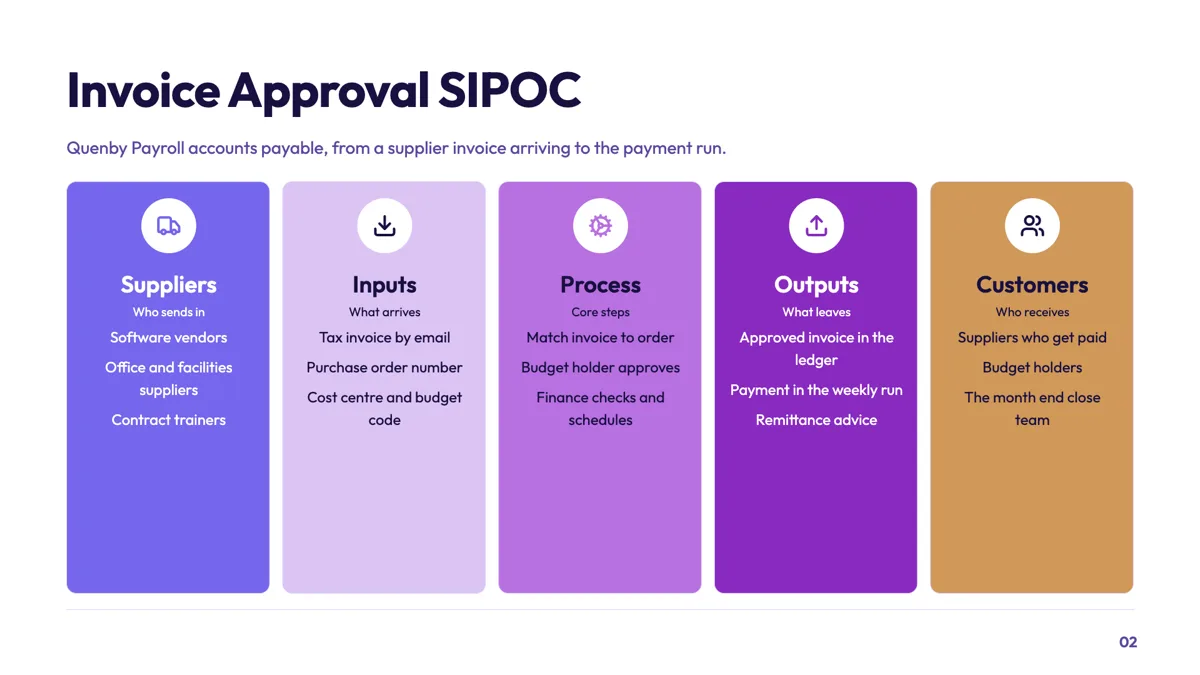
SIPOC slide that scopes an invoice approval process
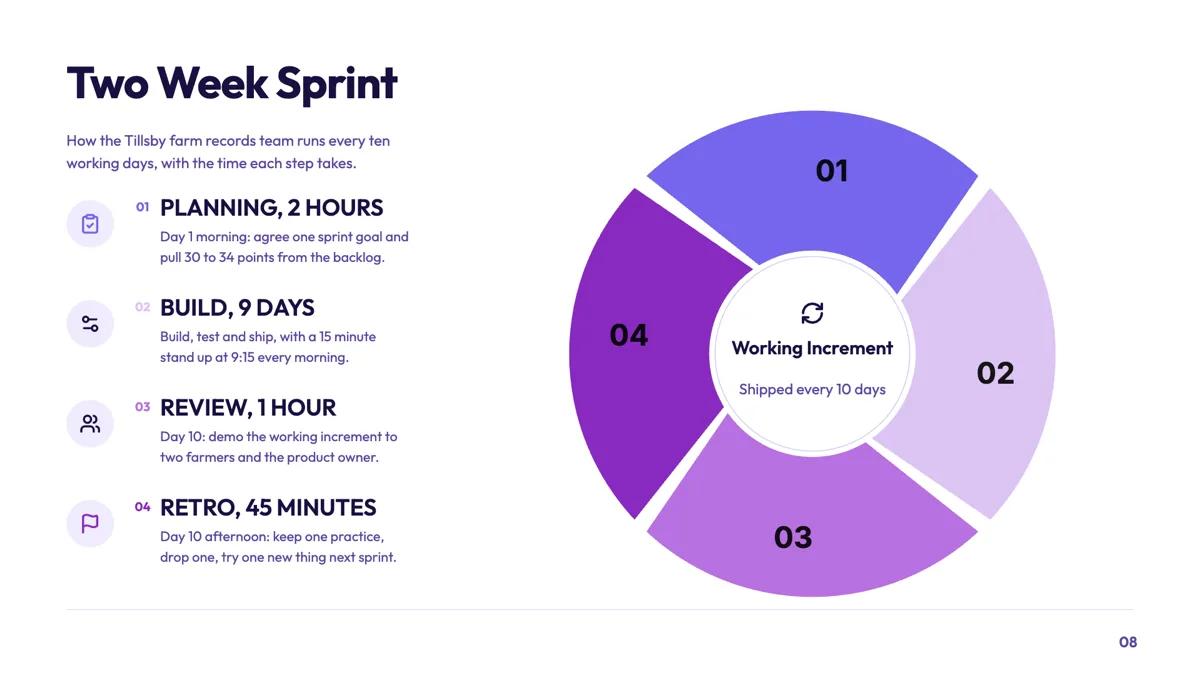
Sprint cycle slide with the length of every ceremony
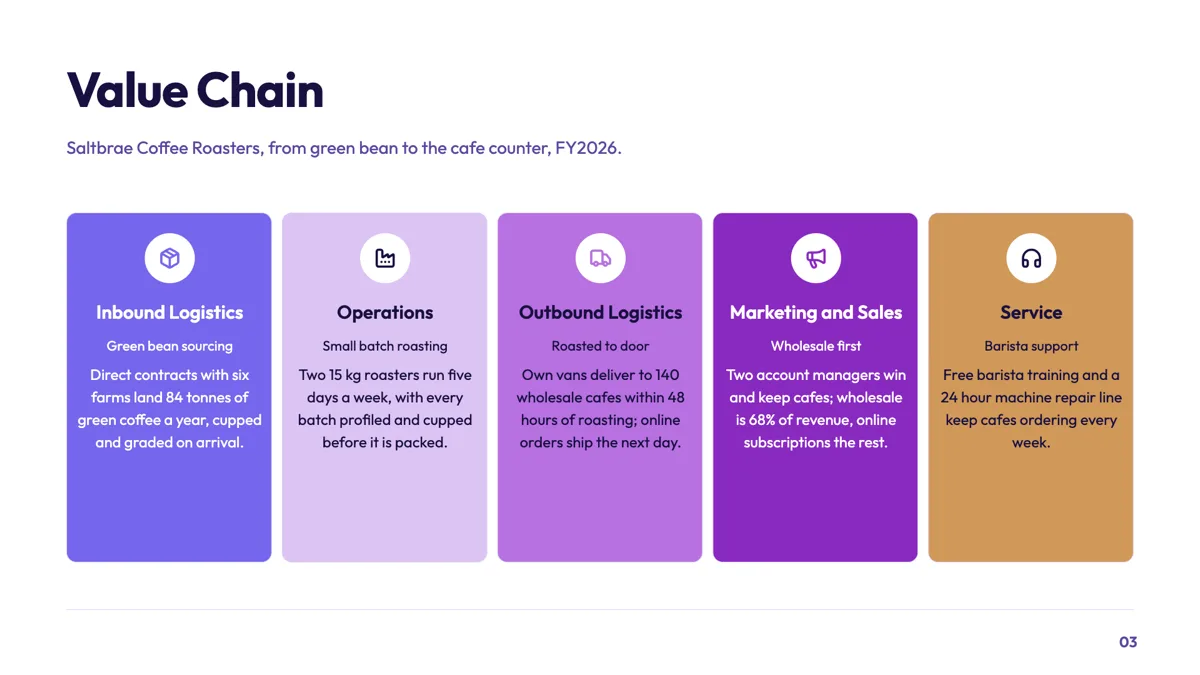
Value chain slide for a small batch coffee roaster
Questions people ask
Can I label the branches out of a decision?
Yes. Every connection carries its own optional label, which is where Yes, No, Approved and Rejected go on the branches out of a diamond. Label every exit from a decision, not just one of them, because an unlabelled arrow leaves the audience guessing which answer it belongs to. Keep the labels to a word or two so they sit on the line cleanly.
Will my node positions be overwritten?
No. The Auto button runs a layered layout once so the graph is not a pile in the corner, and after that a node you drag stays where you put it. The usual workflow is auto layout first, then nudge the two or three boxes the algorithm placed awkwardly. Running Auto again later is your choice, and it does place every node afresh.
Are there swimlanes?
No. If ownership matters, put the owner in the node label, such as Finance: approve invoice, or split the flow across two slides with one per team. A cross team process with many handoffs often reads better as a short sequence of slides anyway, because each team can find its own part of the flow without tracing arrows across the whole diagram.
What if my process has no branches?
Use a process layout instead. Fifteen of the seventeen process layouts are built for a sequence of stages rather than a branching graph, and they give you far more room per step than a flowchart does, with space for a description under each stage. The arrows are implied by the order, so a five step onboarding flow reads faster without drawn connections.
Make your own presentation
The button opens the generator with this use case already described. Change the wording to match yours, generate, then edit anything you like.
Create a presentation with OneCraftRelated pages
Diagrams in a document
You give a diagram its steps and it lays itself out. There are five kinds, and every coordinate is derived from the kind you pick, so there is nothing to align and nothing to nudge.
Org chart slides
An org chart on a slide is not the org chart. It is the part of the structure the audience needs for the next ten minutes, which is almost never the whole company. The component is built for that: three levels, capped, and readable from the back.
Map slides
One map, the world by country, in two modes. Highlight answers where are we, shade answers how much is where. Anything below country level is out of scope, and knowing that before you plan the slide saves a wasted ten minutes.
More finished work of this kind is on the presentation examples hub.
Written and checked by the OneCraft team. Last checked .