Posters templates
Poster templates for tables and statistics
Some studies are carried by a table, a set of headline numbers or a participant flow rather than by a picture. Nine of the 20 portrait boards are built that way, leading with the figures and giving the written sections the space around them.
9 designs
What these designs are for
Take one of these boards when a reader should leave knowing a number. They lead with a results table, a strip of headline statistics, a before and after comparison or a numbered method rail, and they keep the discussion in ordinary section text underneath rather than competing with the evidence. The cards carry the gallery's sample study, so every figure, table row and confidence interval inside them is placeholder content.
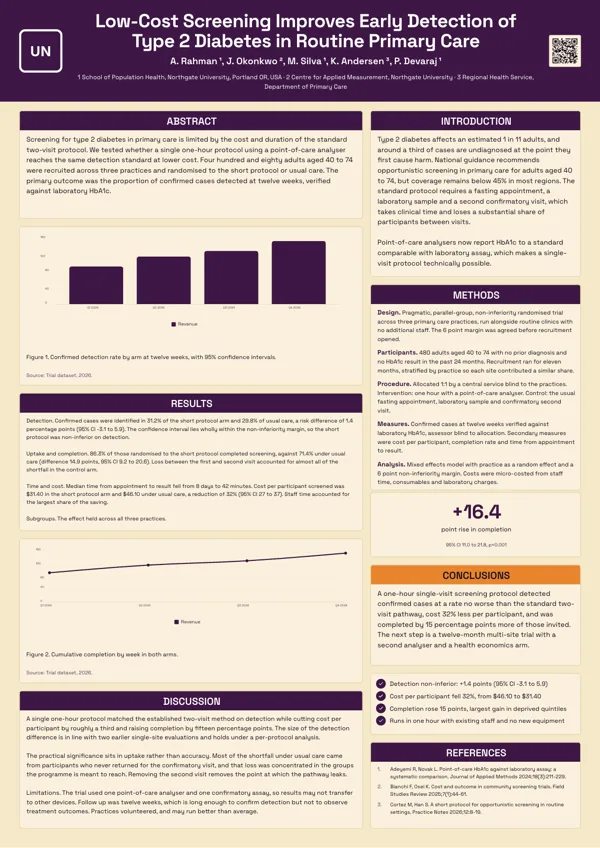
Asymmetric Two Column
A wide evidence column carrying the abstract, two figures and the results, beside a narrow commentary column.
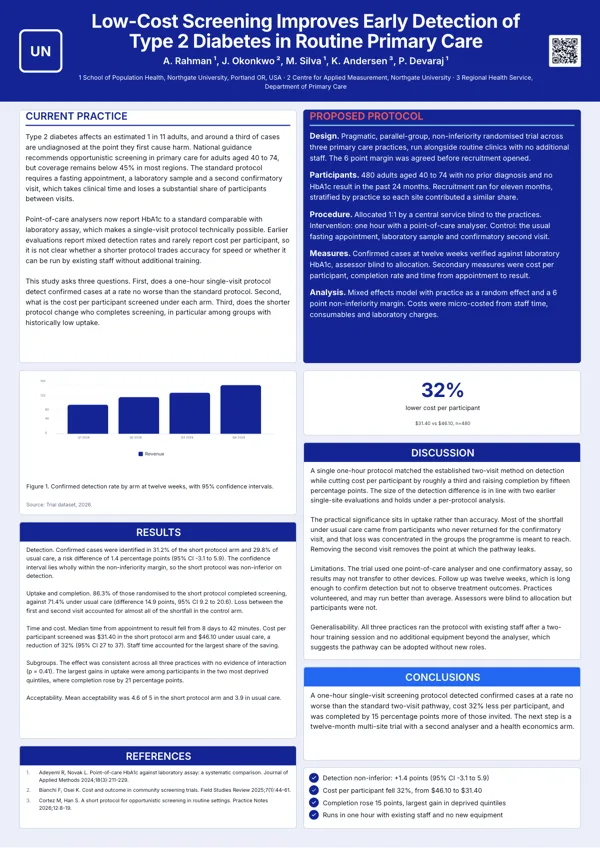
Before and After
Current practice on the left, the proposed method on the right, then results, discussion and conclusions below.
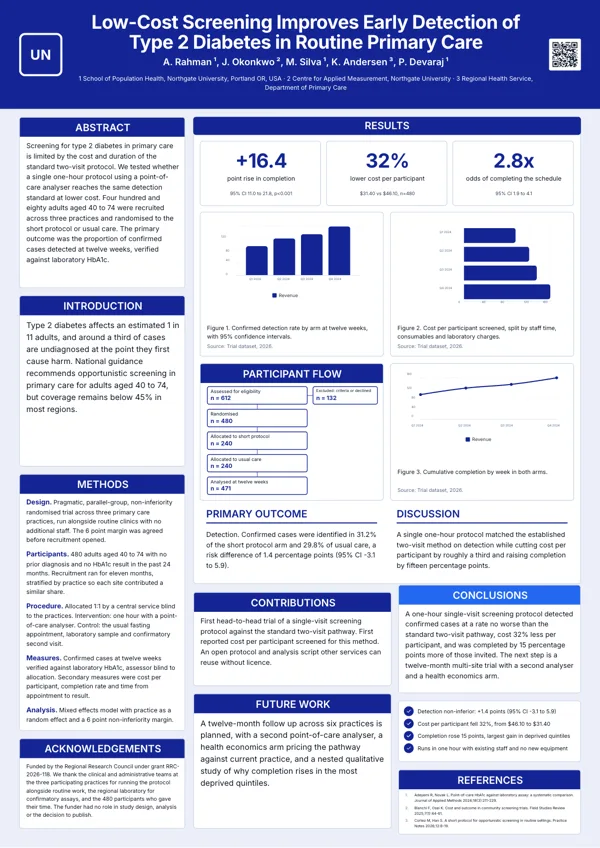
Classic Research Board
The layout most conferences expect: a title band, a narrow left column for abstract and methods, then the evidence.
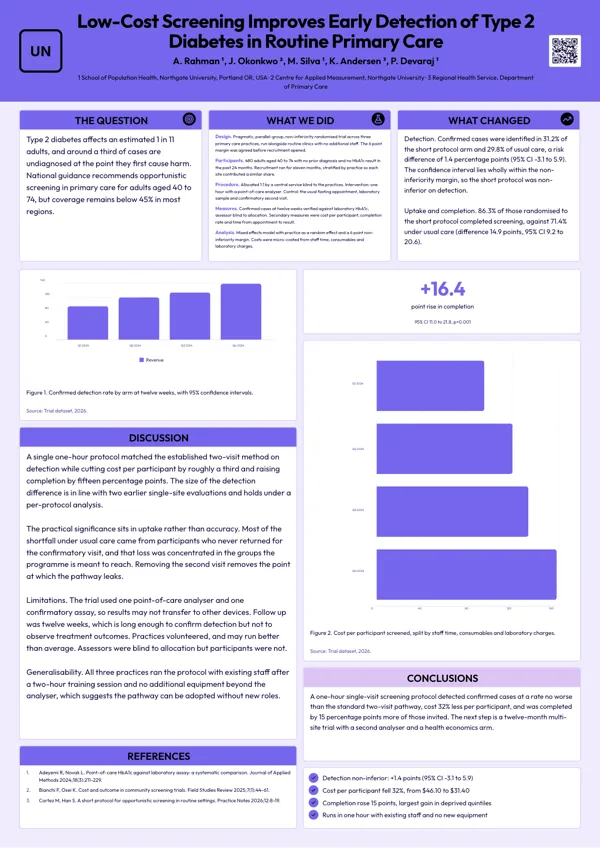
Icon Key Points
Three icon marked cards answer the question, the method and the change before the detailed results.
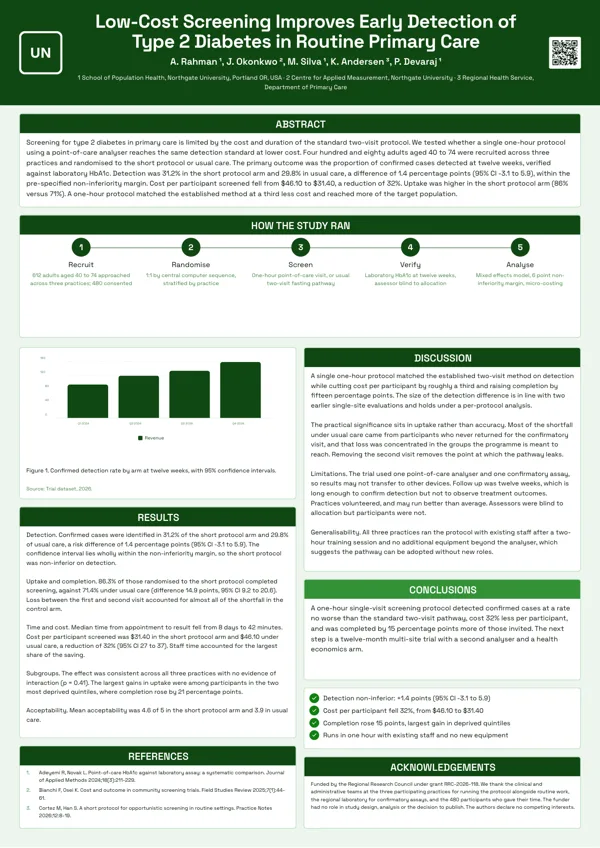
Method Flow
Built around the procedure: a full width row of five numbered method steps, then results and discussion side by side.
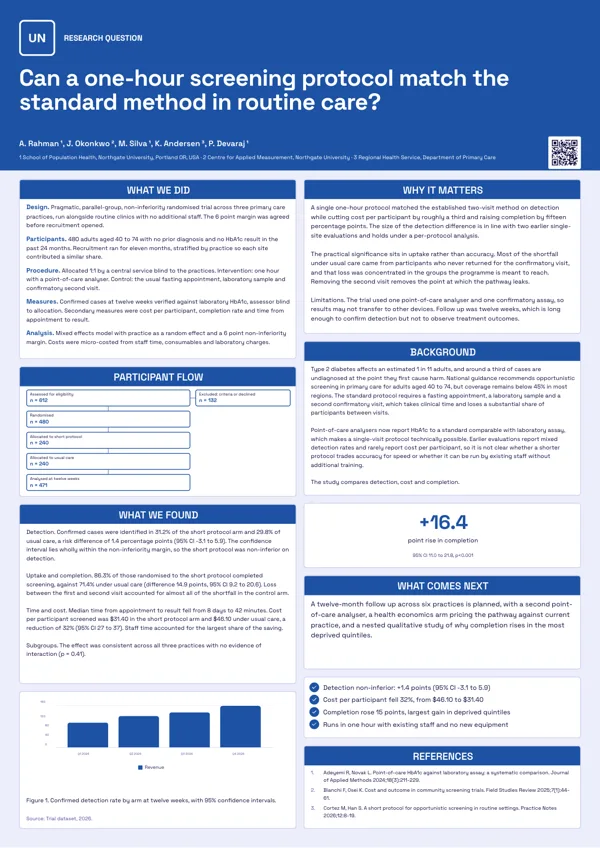
Question Led
Opens with the research question and answers it plainly: what we did, what we found, why it matters.
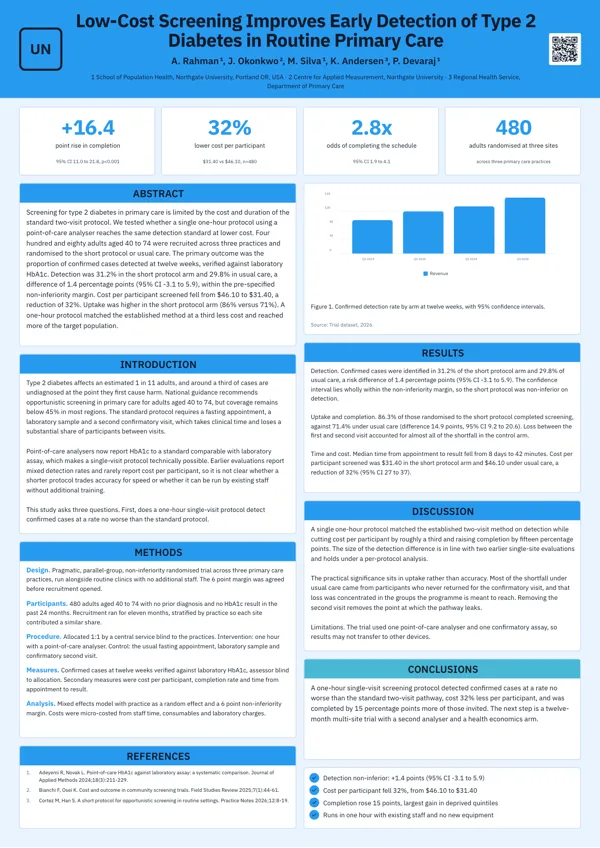
Stat Strip
Four headline numbers sit under the title so the result lands in seconds, then two columns carry the detail.
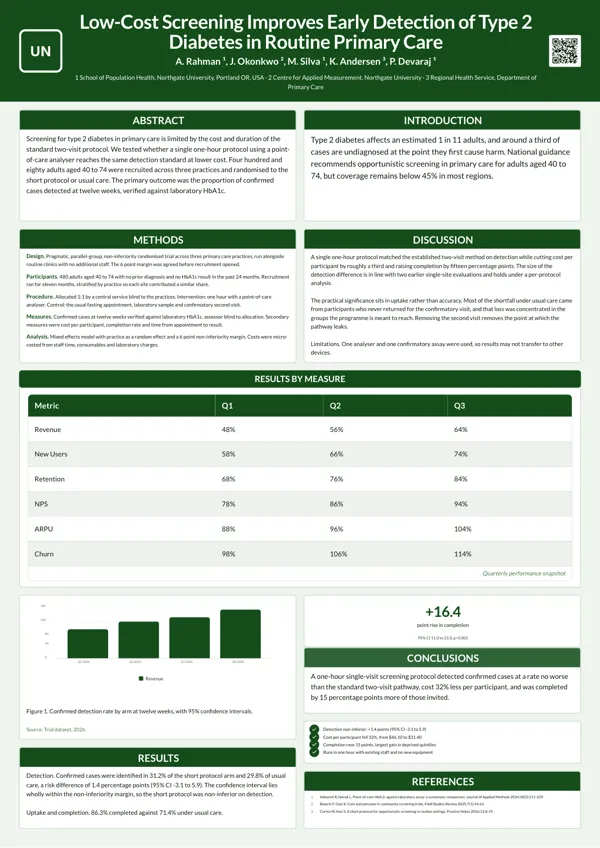
Table Led
The numbers sit in a full width results table rather than a chart, with short text sections above and a figure below.
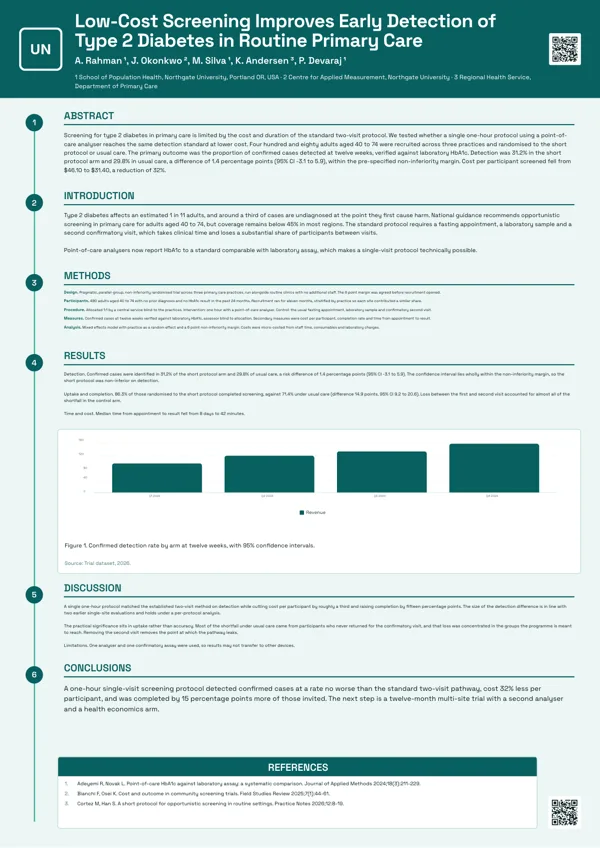
Timeline Rail
A numbered rail down the left edge takes the reader from question to conclusion in one pass.
What these layouts have in common
All nine carry a logo, a title, an author block, section slots, a figure block, a QR code and a reference block, so nothing here drops the citation furniture a reviewer expects. Seven carry a stat block, eight carry a protocol block and eight a list slot. Two carry a CONSORT flow for participant accounting, one carries a full width table and one a process chain. Written sections run from four to eight per board, the widest range in the library, so these are also the boards that hold the most prose while still leading with numbers.
Which one to pick
Sort by what the evidence actually is. A results table takes the table led board, which gives the table the full width and keeps a figure below it. Four comparable headline numbers take the stat strip, where they sit directly under the title. A study comparing current practice with a proposed method takes the before and after board. A trial that has to show recruitment and exclusions takes one of the two boards with a CONSORT flow. A protocol in stages takes the method flow board, with the caveat that its process chain silently drops a sixth step, so keep the procedure to five.
What conferences usually require
Poster printers publish their size lists openly, and A0 and A1 sit beside the American 36 by 48 inch board and metric options such as 70 by 100 centimetres. A0 is 841 by 1189 millimetres. University guides are firmer about content than size: they ask for roughly 300 to 800 words on the whole board and for the important lines to be readable from about three metres. A data board makes that easier, because a number set in display type carries further than a paragraph. Check your own conference instructions for the panel size and whether portrait boards are accepted, since a few venues take landscape only.
Known limits worth planning around
Three things in the poster runtime are worth knowing before you lay out a data board. The process chain drops a sixth step without warning. A chart figure's x axis labels can collide with its series legend when the labels are long, so keep category names short. A table caption can be clipped by its block, so put anything essential in the table itself rather than in the caption. None of these stops a board working, but each is easier to design around than to fix afterwards.
Finished examples
Questions people ask
How many data led poster templates are there?
Nine of the twenty A0 portrait boards. They cover a results table board, a four number stat strip, a before and after comparison, a classic research board, a question led board, an icon key points board, a method flow, a timeline rail and an asymmetric two column board.
Can I align a column of figures to the right?
No. Every table cell is left aligned and there is no per column alignment control, in posters as in flyers. Column widths can be dragged, so a narrow number column still reads reasonably, but the figures will sit left.
How many steps fit in the method flow?
Five. The process chain on that board silently drops a sixth step, so write the procedure as five stages. If the protocol genuinely has more, group two stages into one step and describe the detail in the section text.
What resolution do these print at?
The A0 portrait canvas is 1656 by 2340 pixels at 50 DPI and the export doubles it, so the file is 3312 by 4680 pixels. On a full size A0 print that is about 100 pixels per inch, which is fine at reading distance for a poster but not a press quality image.
Can a reviewer copy the numbers out of the PDF?
No. The PDF holds a bitmap of the rendered board, so text cannot be selected or searched. Supply the data table separately if reviewers need the numbers, or link to it from the QR code that every board here carries.
Can I change the chart type on a figure?
Within the kinds that figure allows. A chart figure on a poster board lists its allowed kinds in the template, drawn from the ten the runtime supports: vertical and horizontal bars, stacked columns, line, area, pie, donut, radar, waterfall and waffle.
Start a poster from a description
The button opens the generator with a starting description already filled in. Change it to match your own before you run it.
Create a poster with OneCraftFor everything the generator can do, see the poster maker.
Other poster examples sets
Written and checked by the OneCraft team. Last checked .