Slides templates
Research deck templates
A research talk moves from question to method to evidence to what it means, and each of those steps wants a different slide. Twelve layouts across four roles cover the sequence, chosen from the 369 slide templates for how much structure they can hold.
12 designs
What these designs are for
Use this for a thesis defence, a conference talk or an internal research readout where the audience will judge the method as well as the result. These layouts carry a named framework, a real diagram and multi series charts, rather than asking a bullet list to do the work.
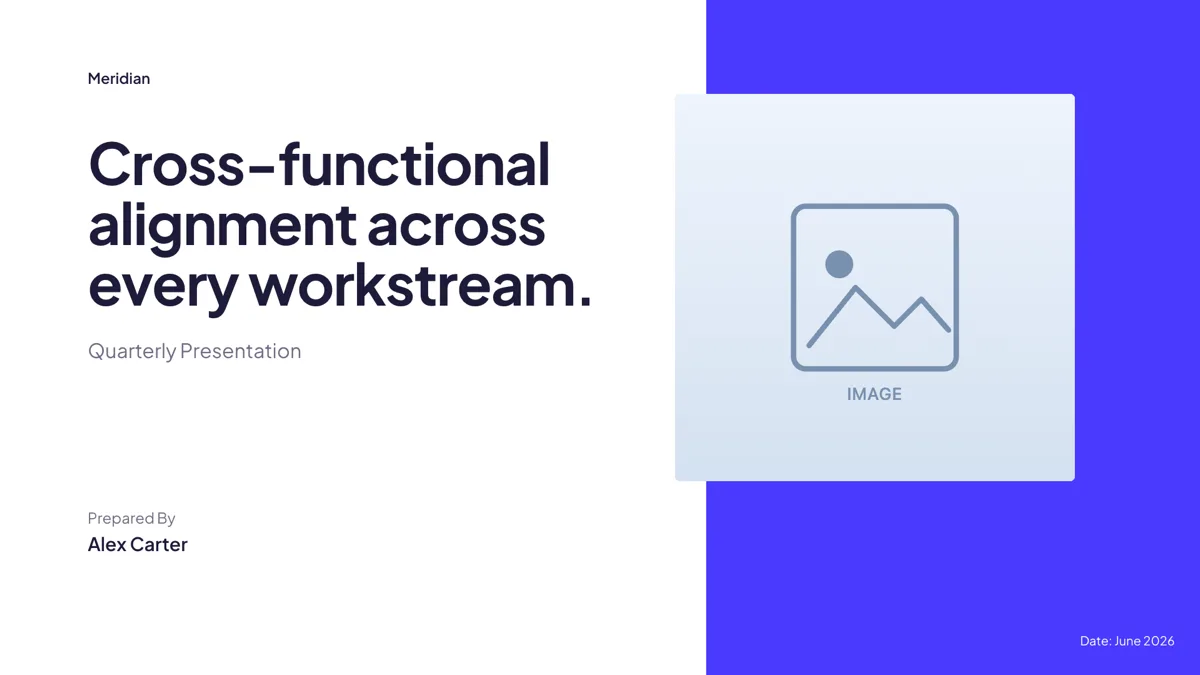
Cover: Report Panel + Metadata
Cover. A formal report cover with a large two line title and prepared by metadata low in the column.
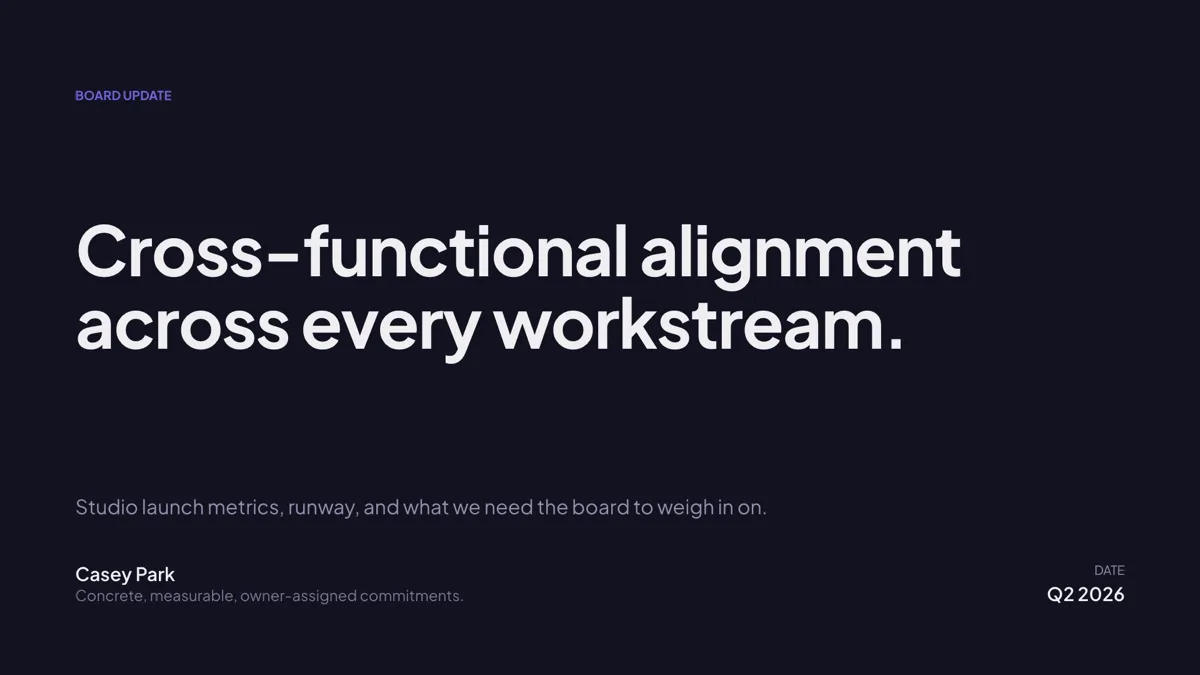
Cover: Minimal Typographic
Cover. No imagery: a display title, a small eyebrow, a byline and a date corner.
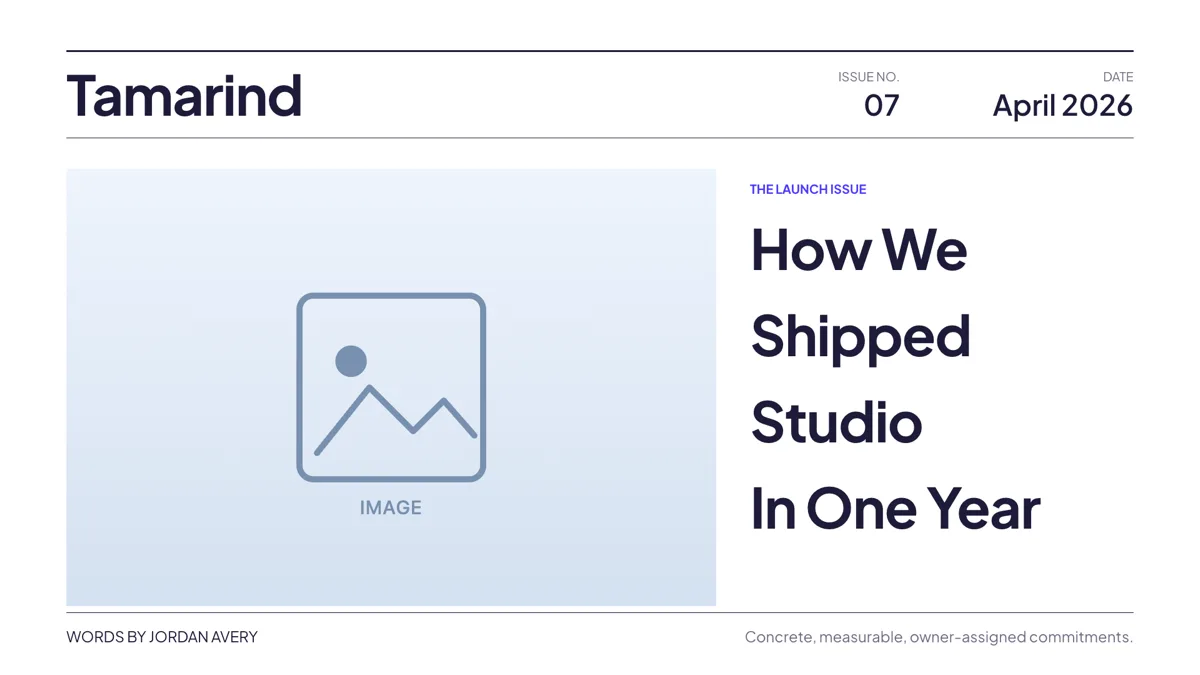
Cover: Magazine Nameplate
Cover. A masthead with issue and date over a tall editorial hero image and a stacked title.
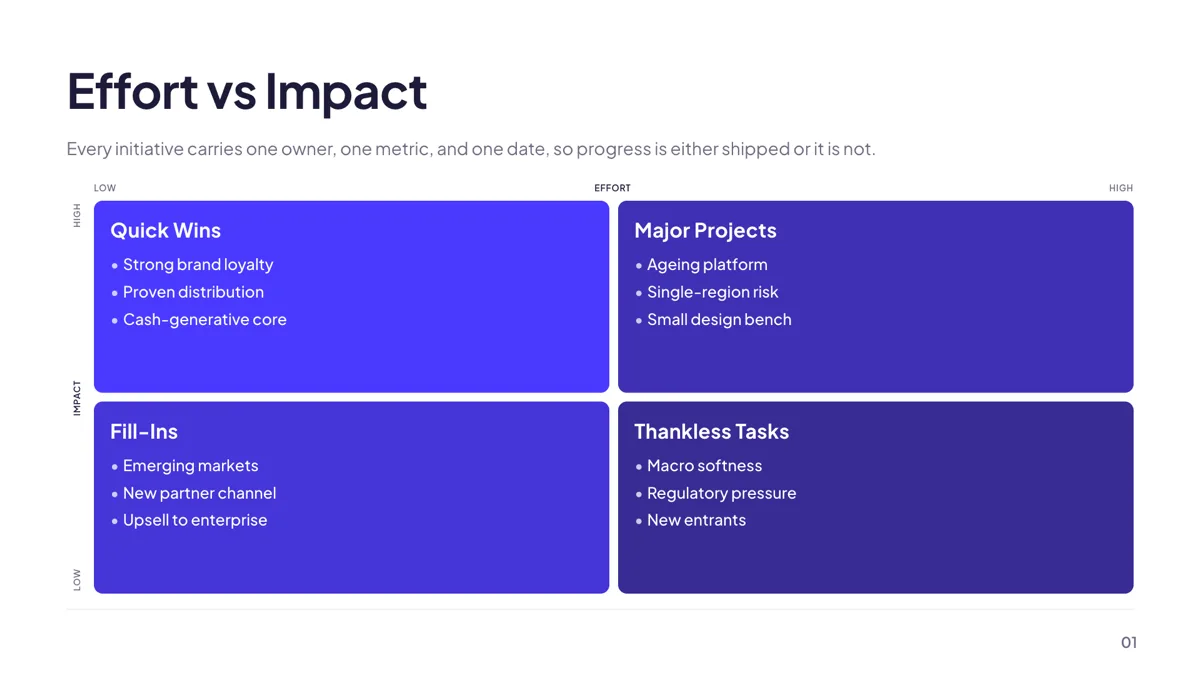
Grouping: Effort vs Impact
Framework. An effort against impact grid with the four quadrants labelled and the items placed in them.
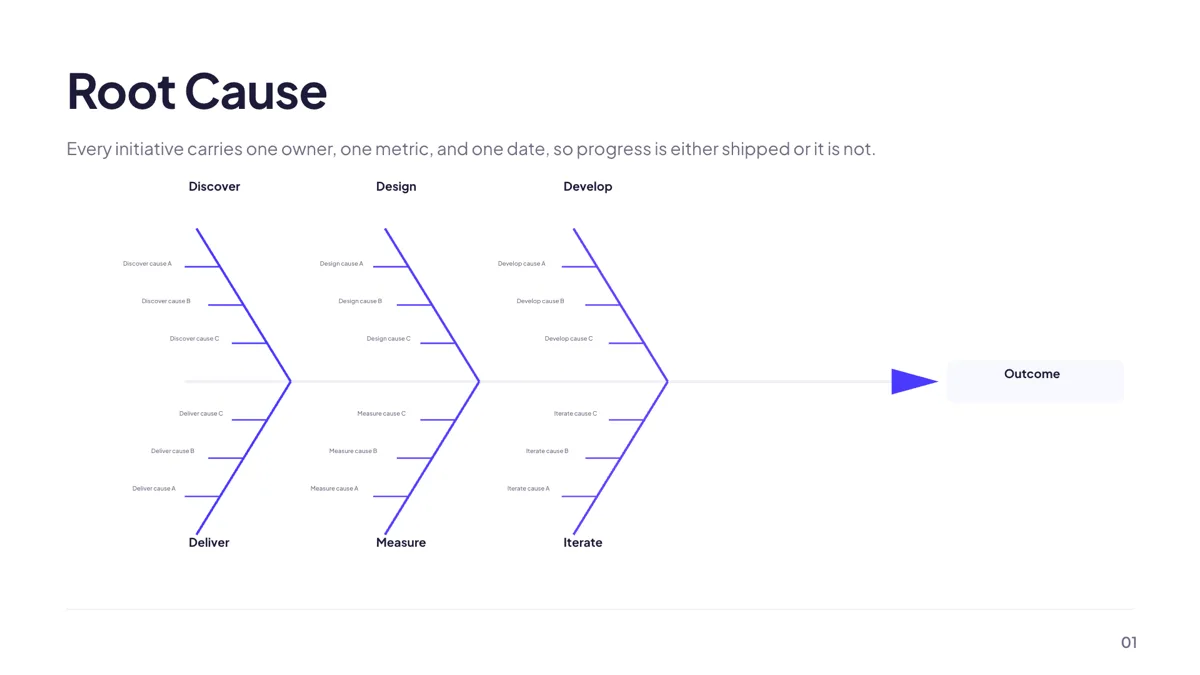
Grouping: Fishbone Cause & Effect
Framework. An Ishikawa fishbone with the effect on the spine and four to six labelled cause branches.
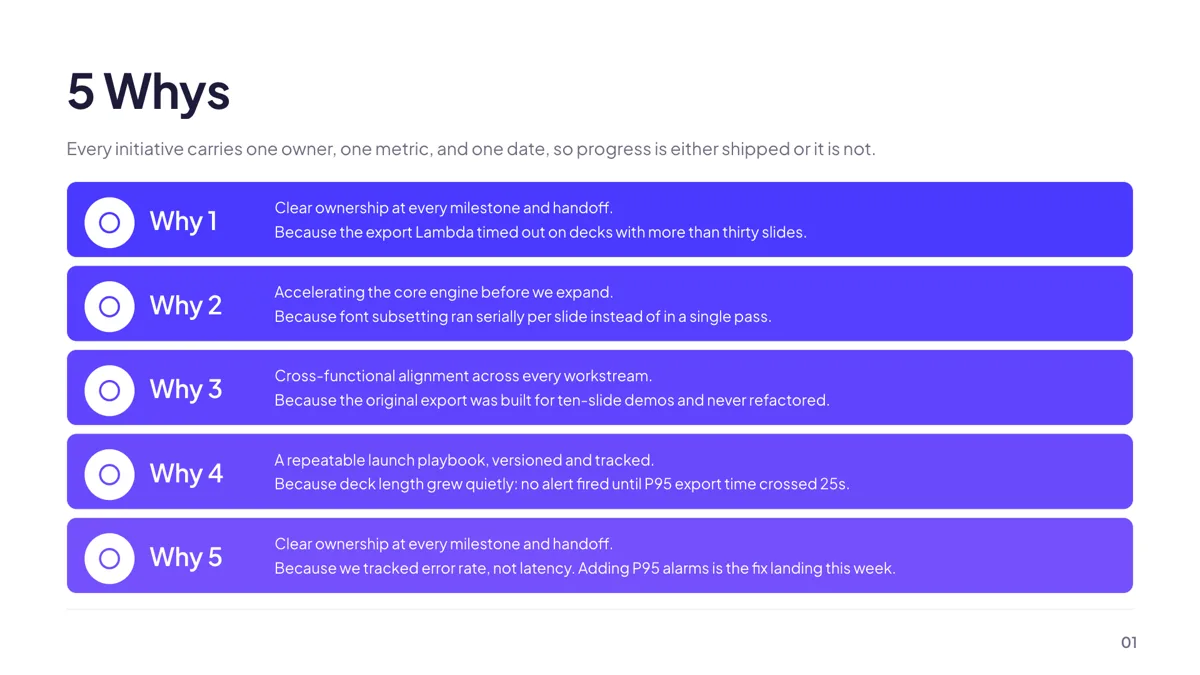
Grouping: 5 Whys Vertical
Framework. Five stacked rows, each a why badge, the question and the because answer beneath.
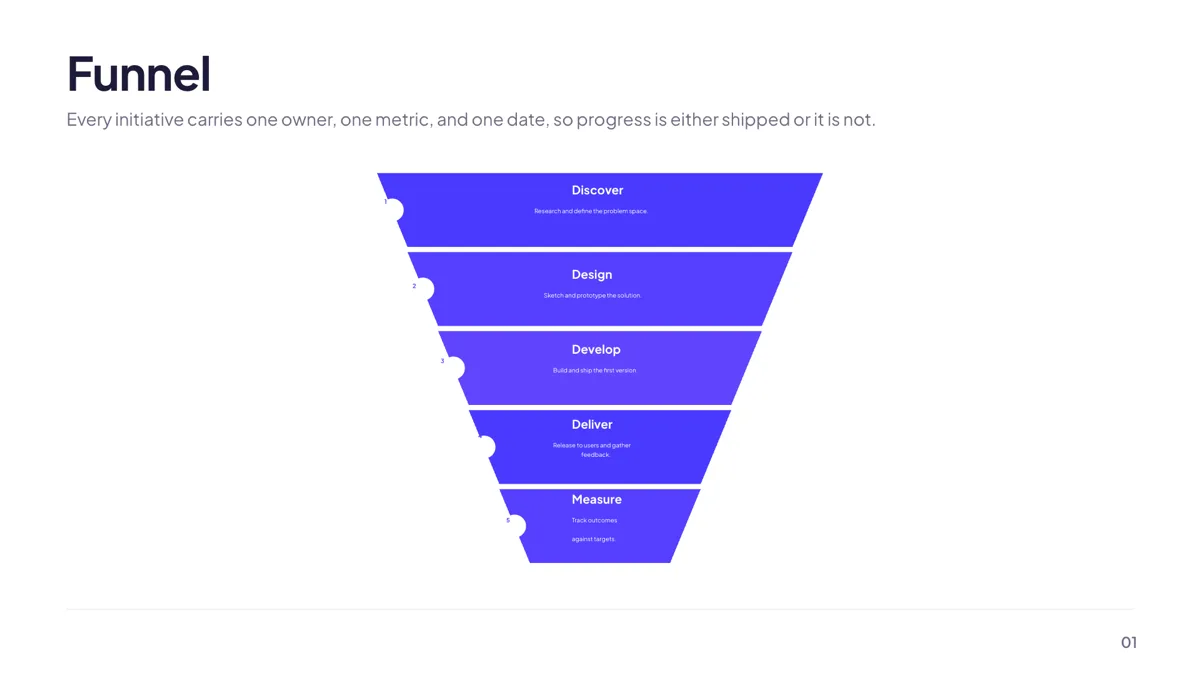
Grouping: Funnel Stages
Diagram. A three to five stage funnel narrowing down the slide, each stage a label and a sentence.
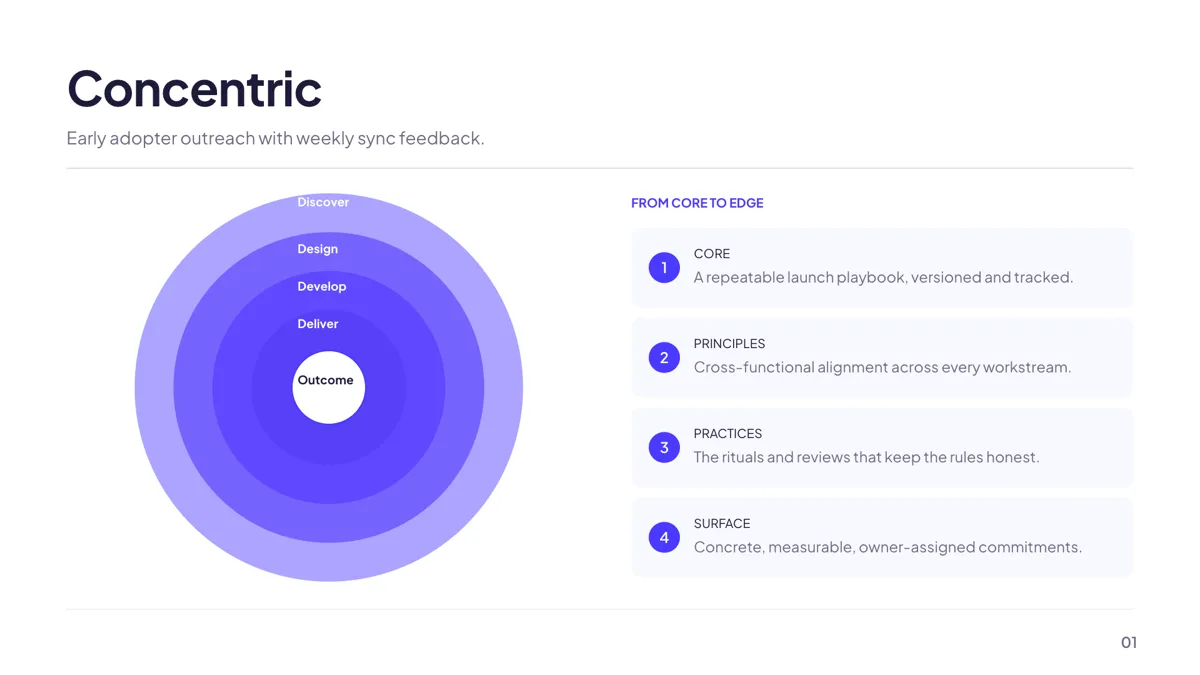
Grouping: Concentric Core
Diagram. Four concentric rings on the left with a numbered legend naming each layer on the right.
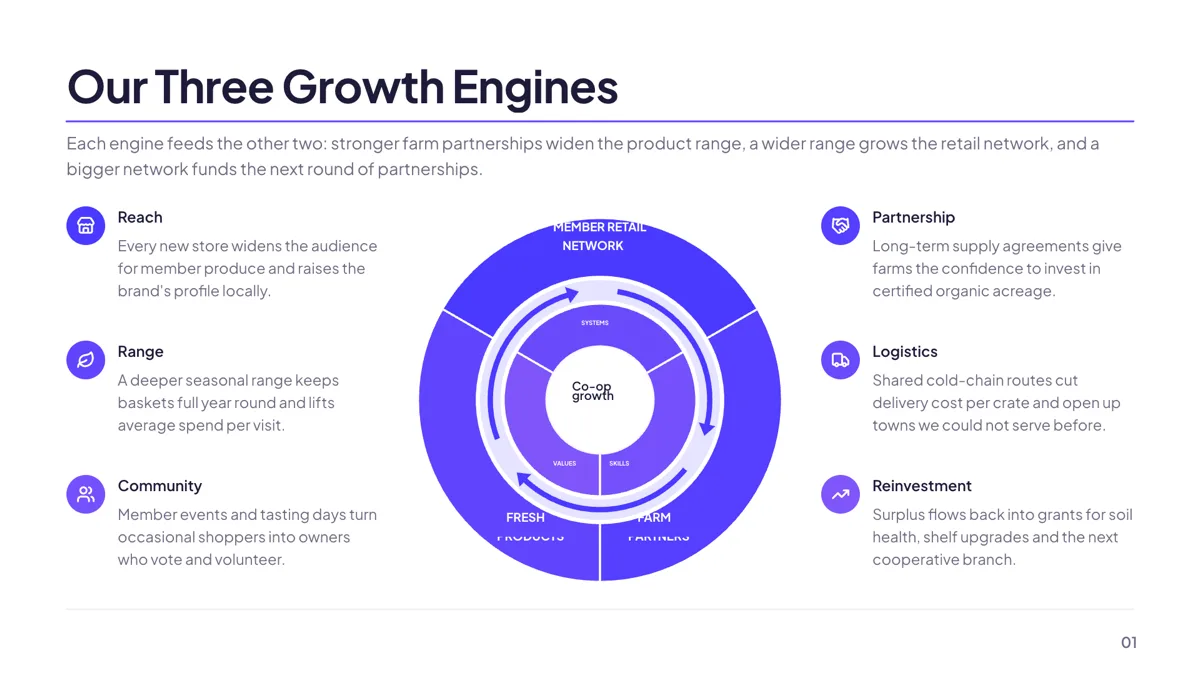
Hub Ring with Six Callouts
Diagram. A hub ring split into coloured segments with an inner ring of matching enablers.
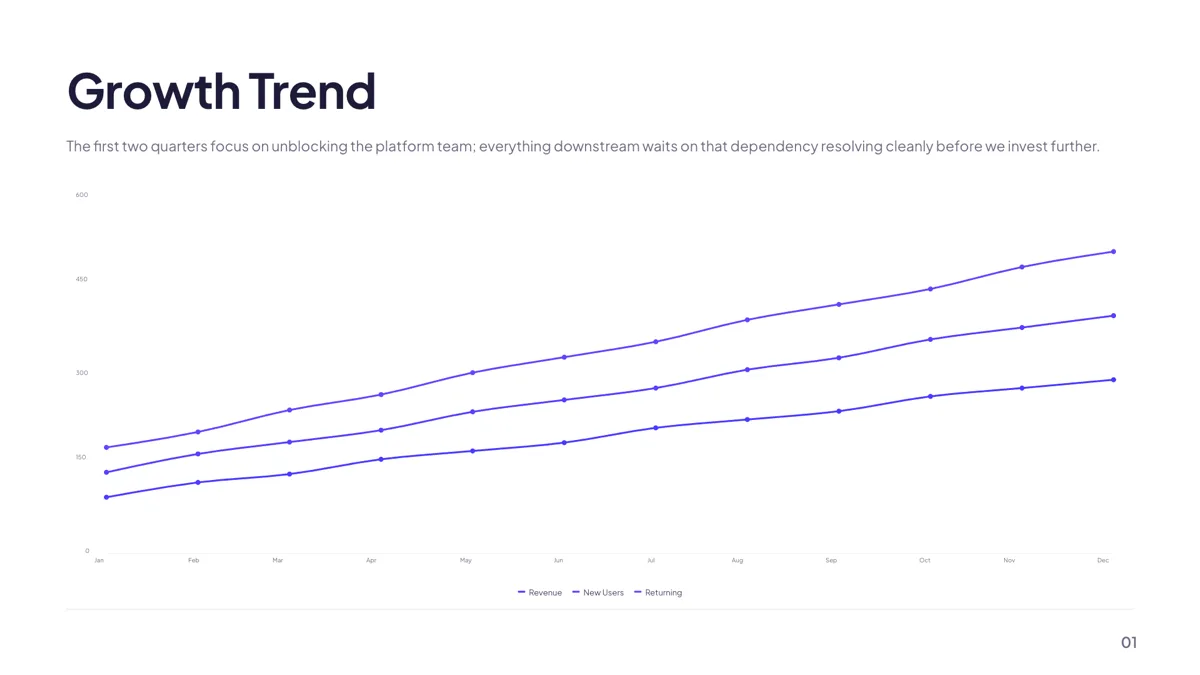
Metrics: Multi-Series Line Trend
Metrics. A multi series line chart over six to twelve buckets with a legend and a framing subtitle.
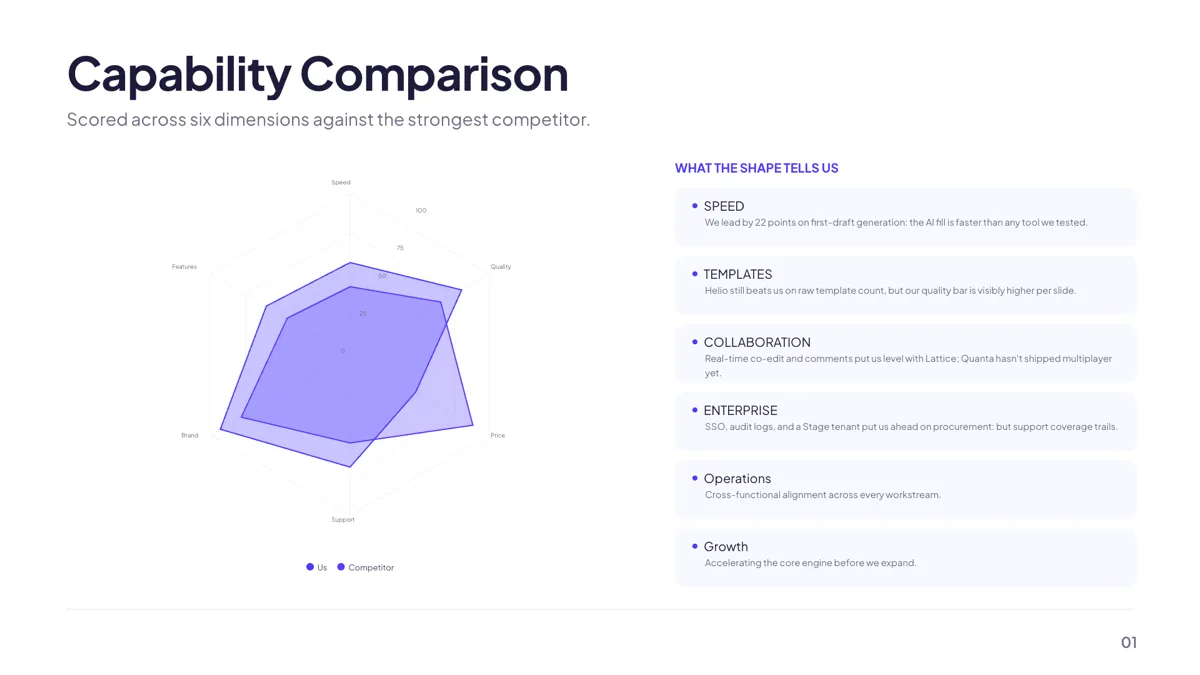
Metrics: Radar Multi-Dimensional
Metrics. A radar chart scoring two or three entities across five to eight axes, with a sidebar.
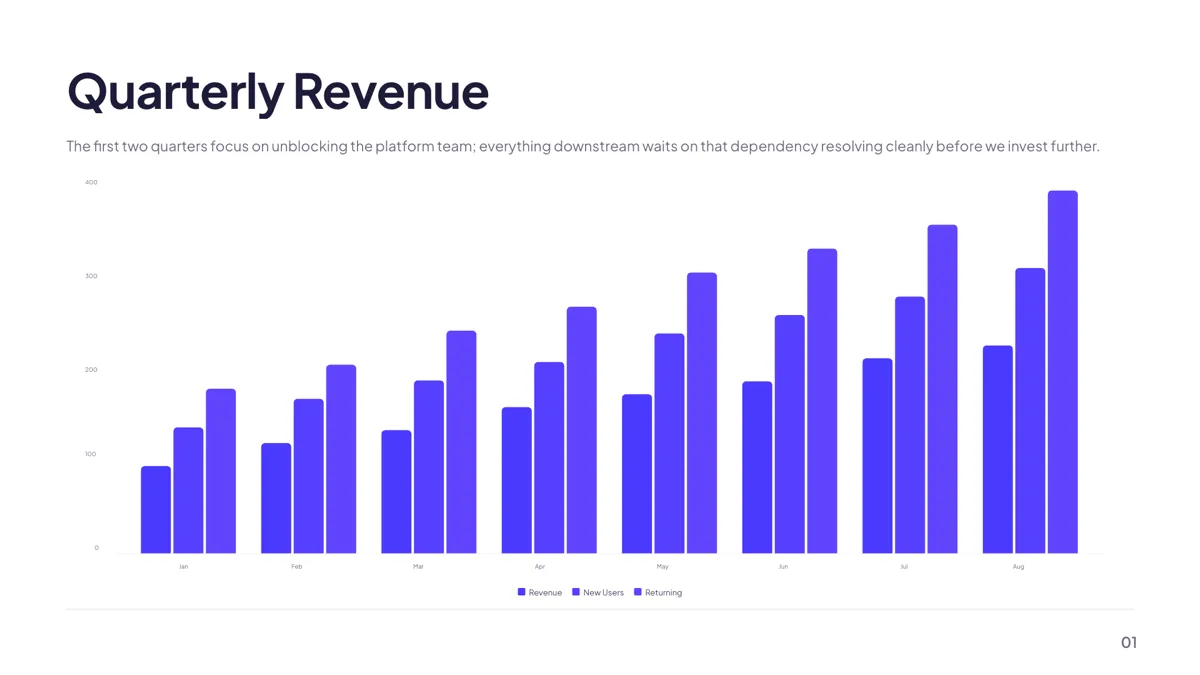
Metrics: Vertical Bar Chart
Metrics. A vertical bar chart with a title, a framing subtitle and a legend under the plot.
Cover: the metadata matters more than the picture
Of the 27 cover layouts, three suit research: a report cover with a prepared by block, a minimal typographic cover, and a magazine nameplate when the work is being presented as a publication. A research cover has to carry the title, the authors and the date legibly, which the photographic covers do less well. Page numbers render zero padded on the 320 of 353 templates that use the theme footer, and the section label is hidden by default outside the editor.
Framework: 23 named structures
The framework role holds 23 templates and they are named structures rather than generic grids: SWOT, PESTEL, the 5 Whys, Ansoff, BCG, a balanced scorecard, Porter's five forces, an Eisenhower matrix, a risk matrix, effort against impact and a fishbone among them. Using the right one is an argument in itself, because the audience recognises the shape. Matrix kinds are limited to three, quadrants, a three by three axis and SWOT, and the inspector lets a quadrant or SWOT matrix switch between those two but keeps a three by three as itself.
Diagram: 20 layouts, and no pin map
Twenty templates sit under diagram, covering funnels, cycles, pyramids, honeycombs, venn diagrams, concentric rings and hub and spoke rings. The element library offers twelve diagram kinds; a thirteenth exists in the types but only inside a template. One thing to plan around: the map is a world countries map with highlight and choropleth modes, and no template ships marker data, so a study site cannot be pinned to a city.
Results: what the chart slots will draw
Ten chart kinds are available: vertical and horizontal bars, stacked columns, line, area, pie, donut, radar, waterfall and waffle. A chart that came with a layout offers only that layout's allowed kinds, usually three or four, while a chart dropped in from the element library carries all ten. Series colours are remapped in spectrum and outline modes and keep the brand colour in matching and dark, so a series cannot be painted into the background and disappear.
What is inside the thumbnails
The cards are layouts rendered by the template library with its own sample content, which is what the public gallery shows. Read the figures, axis labels and quadrant entries in them as placeholder writing. The SWOT layout is named rather than pictured because its sample text analyses this product, which would be a claim rather than an illustration.
How long a research talk runs
The research decks published here are 9 to 12 slides: a conference talk deck at 9, a science lesson at 11 and a thesis defence at 12. The takeaway role has only seven layouts in the library and they are shown on the business review and training pages, so the conclusion slide here is best built from the closing or content roles, or from the takeaway page linked under the deck structure guide.
Finished examples
Questions people ask
How many slides for a conference talk?
The conference talk deck published here is 9 slides and the thesis defence is 12. For a 15 minute slot, 9 to 12 slides with one idea each is the working range, which matches what the length slider will generate on a paid plan.
Can a slide cite its sources?
Not automatically. The outline plans a sources array per slide and the fill reads it as grounding, but nothing in the editor renders it, so citations are text you type onto the slide like any other content.
Can I map study sites by city?
No. The map component draws world countries in highlight or choropleth mode. Marker data exists in the types and the renderer, but the AI schema only offers countries, the inspector has no marker editor and no template ships markers, so a city pin is not available.
Which chart types can a results slide use?
Ten in total: vertical bar, horizontal bar, stacked column, line, area, pie, donut, radar, waterfall and waffle. A chart that came with the layout offers only the kinds that layout allows, which is three or four, so drop in a chart from the element library if you need the full set.
Can I show research on one slide in the appendix?
Yes, and the deck can run longer than the talk: generation caps at 20 slides on a paid plan, and slides can be added by hand afterwards without limit. Present mode skips nothing, so keep appendix slides after the close.
Does the AI do the literature search?
It runs a small, bounded search while planning: one web search call taking the top five snippets and one fetch of at most two URLs at 20,000 characters each, for the whole deck. That is grounding, not a literature review, and it produces no citations.
Start a slide from a description
The button opens the generator with a starting description already filled in. Change it to match your own before you run it.
Create a presentation with OneCraftFor everything the generator can do, see the slide maker.
Other slide examples sets
Sources
Written and checked by the OneCraft team. Last checked .